What shapes the pattern of trade
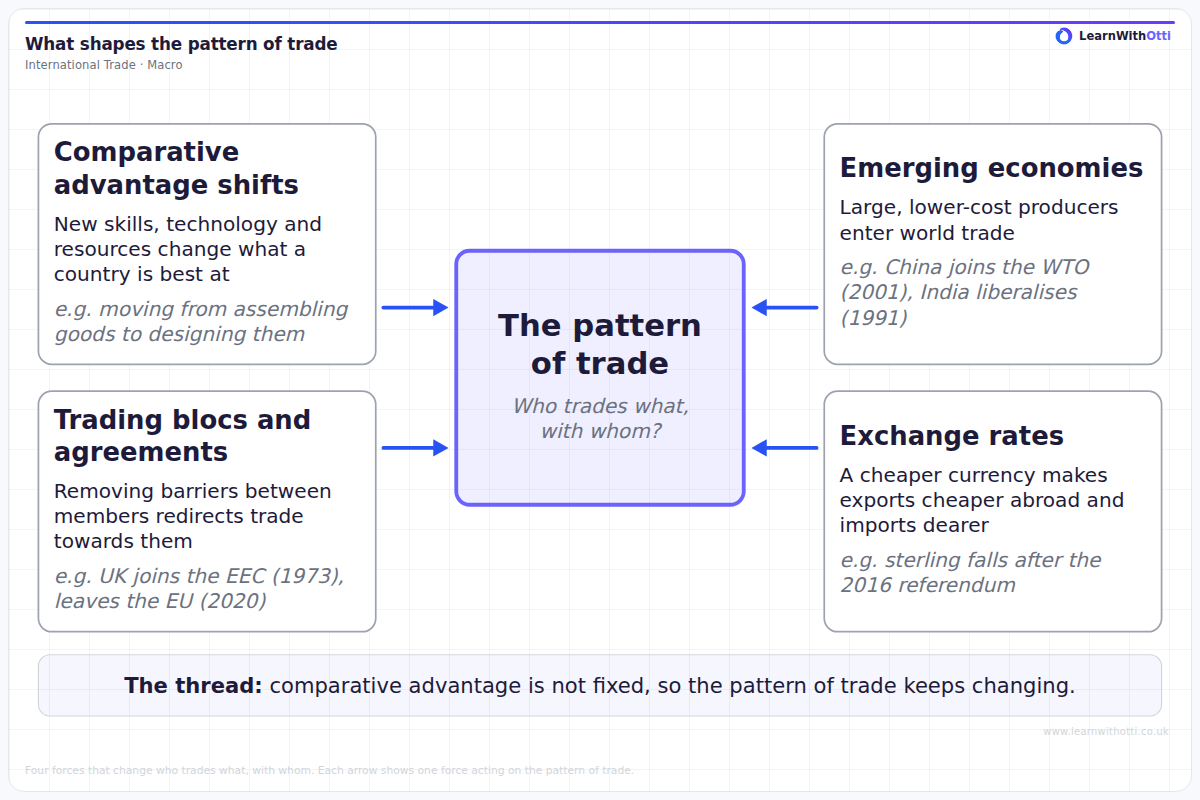
Concept map of four forces that change the pattern of trade: shifting comparative advantage, the entry of emerging economies such as China and India, trading blocs and agreements such as the UK joining the EEC and leaving the EU, and exchange rate changes such as the fall in sterling after the 2016 referendum.
Printable preview
Download a static PNG of this diagram to print or include in revision notes.
Download PNGWhat this diagram shows
The pattern of trade is who trades what, with whom: which goods and services a country exports and imports, and which countries it trades with. This diagram puts the pattern of trade at the centre and shows four forces that change it. First, comparative advantage shifts: new skills, technology and resources change what a country can produce at the lowest opportunity cost, so a country may move from assembling goods to designing them. Second, emerging economies enter world trade: large, lower-cost producers such as China, which joined the WTO in 2001, and India, which liberalised its economy in 1991, become major sources of imports for other countries. Third, trading blocs and agreements remove barriers between their members, which redirects trade towards those members; the UK joined the EEC in 1973 and left the EU in 2020. Fourth, exchange rates change relative prices: a cheaper currency makes a country's exports cheaper abroad and its imports dearer, as when sterling fell after the 2016 referendum. The strip along the bottom gives the thread that joins them: comparative advantage is not fixed, so the pattern of trade keeps changing.
Key points
- The pattern of trade describes which goods and services a country exports and imports, and which countries it trades with.
- Comparative advantage is not fixed: new skills, technology and resources change what a country can produce at the lowest opportunity cost.
- Emerging economies with large, lower-cost workforces change the pattern of trade when they enter world trade, as China did on joining the WTO in 2001 and India did after liberalising in 1991.
- Trading blocs and trade agreements remove barriers between members, which redirects trade towards members and away from non-members; the UK joined the EEC in 1973 and left the EU in 2020.
- A depreciation makes a country's exports cheaper abroad and its imports dearer, which changes the volume and direction of its trade; sterling fell after the 2016 referendum.
- These forces often act together, so a change in a country's trading partners usually has more than one cause.
Exam tip
When you use this diagram, pick the driver that fits the change you are explaining and follow its arrow all the way through: say what changed, how it changed relative costs or prices, and how that changed who trades with whom. For example, a fall in sterling makes UK exports cheaper abroad and imports dearer, so it changes the amounts the UK buys from and sells to other countries. Then link back to comparative advantage, because most changes in the pattern of trade come down to a change in where goods can be produced at the lowest opportunity cost.
Common mistakes
A common mistake is to treat comparative advantage as permanent, as if a country is always best at the same goods. It changes as skills, technology and resources change, which is exactly why the pattern of trade changes. Another is to confuse the pattern of trade with the volume of trade: the pattern is about what is traded and with whom, not just how much. A third is to say a trading bloc simply increases trade; removing barriers between members can also divert trade away from lower-cost producers outside the bloc.
Related diagrams
Ask Otti about this diagram
Our AI tutor can walk you through every curve, explain exam technique, and quiz you on it.