Comparative Advantage and Specialisation
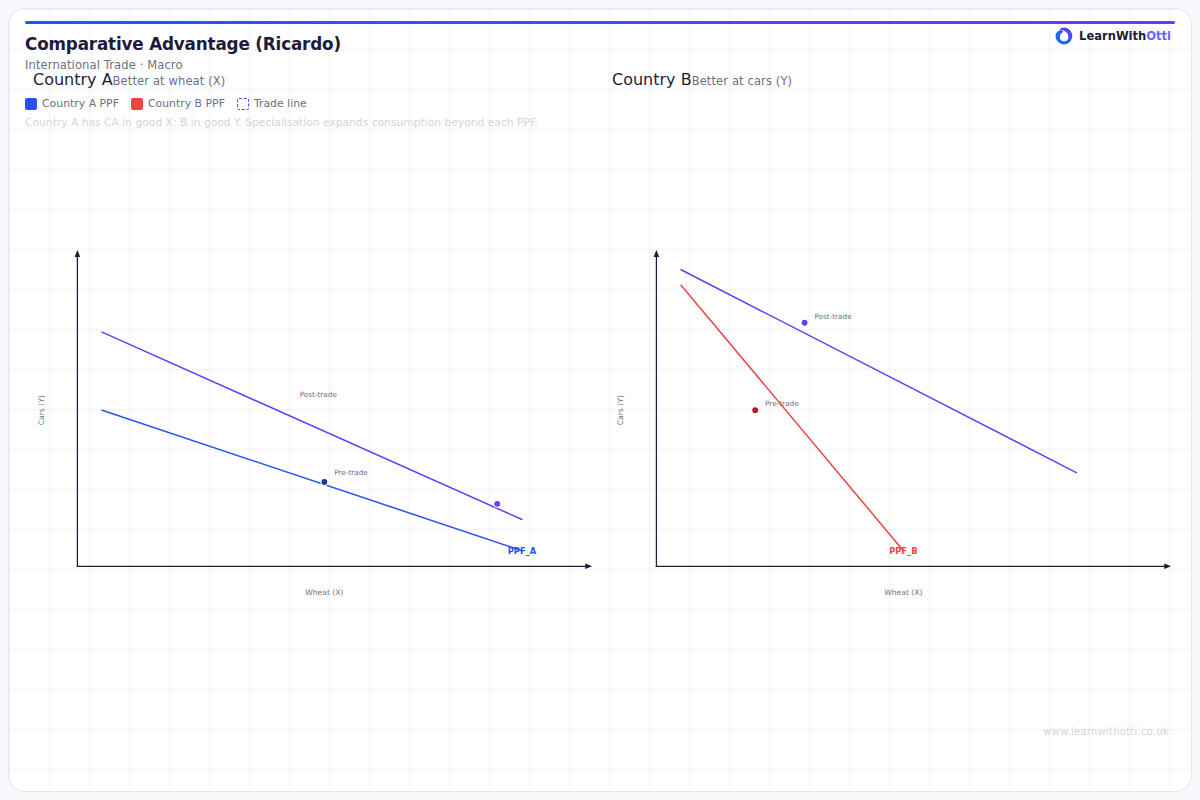
PPF-based diagram illustrating comparative advantage: countries gain from specialisation and trade even if one country has an absolute advantage in producing all goods.
Printable preview
Download a static PNG of this diagram to print or include in revision notes.
Download PNGWhat this diagram shows
This diagram illustrates how countries can benefit from trade by specialising in producing goods where they have the lowest opportunity cost (comparative advantage), rather than trying to produce everything themselves. It shows that even if one country is more efficient at producing all goods (absolute advantage), both countries can still gain from trade by focusing on their comparative advantages. This leads to increased total output, economic growth, and higher living standards for both trading partners through more efficient resource allocation.
Key points
- Comparative advantage exists when a country can produce a good at a lower opportunity cost than another country, even if it has higher absolute costs
- Specialisation allows countries to focus resources on producing goods where they have comparative advantage, increasing overall efficiency
- Trade enables both countries to consume beyond their individual production possibility frontiers, creating mutual gains
- Total world output increases when countries specialise according to comparative advantage rather than trying to be self-sufficient
- The gains from trade can contribute to long-term economic growth through improved productivity and resource allocation
Exam tip
Students often confuse absolute advantage with comparative advantage - remember that a country can have comparative advantage even if it's worse at producing everything! Examiners are impressed when you can calculate opportunity costs accurately and explain how trade benefits both countries even when one is more efficient at everything.
Common mistakes
Students frequently mix up absolute and comparative advantage, thinking the country that's best at everything should produce everything. They also struggle to calculate opportunity costs correctly, often using absolute numbers instead of ratios.
Exam board notes
All major exam boards treat this diagram identically, with AQA and Edexcel typically asking for numerical calculations of opportunity costs, while OCR and CIE may place slightly more emphasis on linking specialisation to economic growth theories.
Related diagrams
Ask Otti about this diagram
Our AI tutor can walk you through every curve, explain exam technique, and quiz you on it.