Harrod-Domar Growth Model
Circular flow diagram showing the Harrod-Domar virtuous cycle of growth: increased savings fund increased investment, which improves the capital stock and raises GDP, feeding back into further savings.
Printable preview
Download a static PNG of this diagram to print or include in revision notes.
Download PNGWhat this diagram shows
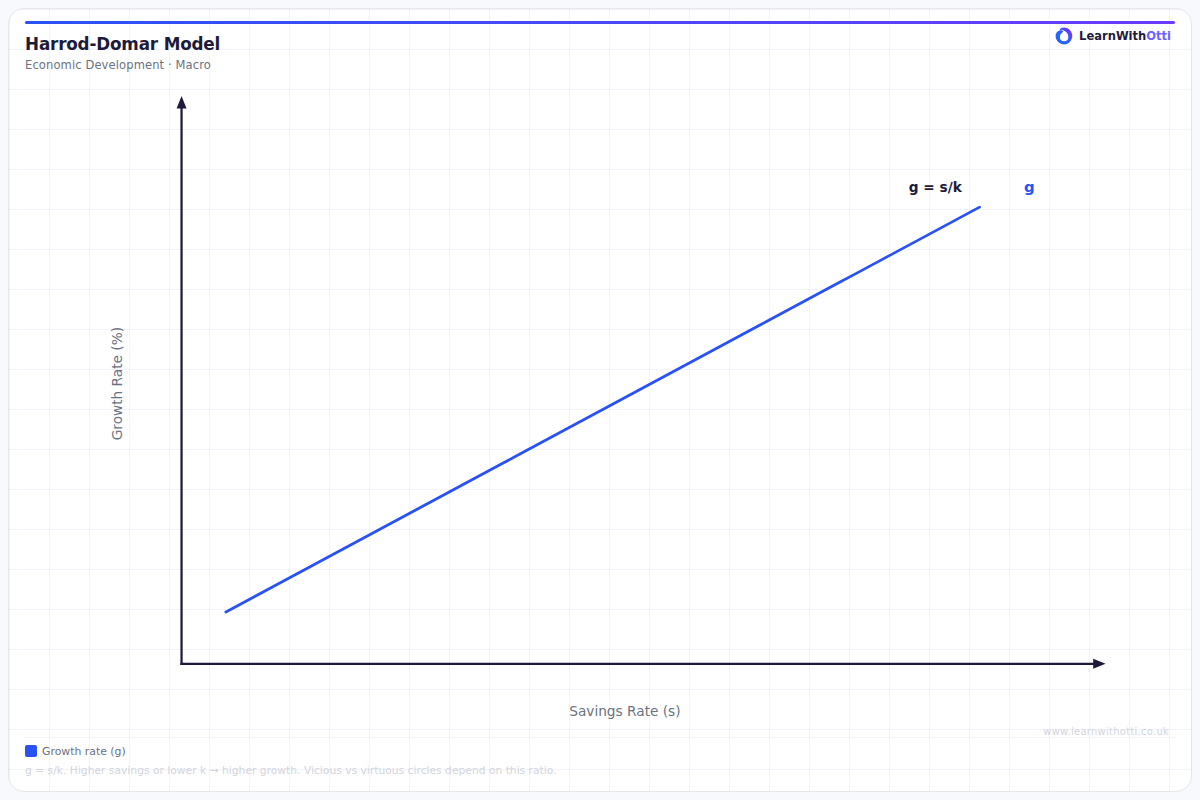
The Harrod-Domar Growth Model demonstrates how economic growth depends on the level of saving and investment in an economy. It shows that growth rate equals the savings rate divided by the capital-output ratio (G = S/K). This model is crucial for understanding why developing countries often struggle to achieve high growth rates without sufficient domestic savings or foreign investment. The diagram typically shows how different combinations of savings rates and capital efficiency lead to different growth outcomes.
Key points
- Growth rate (G) = Savings rate (S) ÷ Capital-output ratio (K)
- Higher savings rates lead to more investment and faster economic growth
- A lower capital-output ratio means capital is more productive, leading to higher growth
- The model assumes a constant relationship between capital investment and output
- Explains why developing countries often need foreign aid or investment to break out of low-growth cycles
Exam tip
Students often confuse the Harrod-Domar model with the production possibility frontier or Solow model - make sure you clearly identify it shows the relationship between savings rate, capital-output ratio and growth rate. Examiners are impressed when you can explain why the model suggests developing countries need high savings rates or foreign investment to achieve sustained growth.
Common mistakes
Students frequently mix up the capital-output ratio with the output-capital ratio, getting the formula backwards. They also often forget that the model assumes full employment and constant returns to scale, which limits its real-world applicability.
Exam board notes
AQA and Edexcel focus more on the policy implications for developing countries, while OCR tends to emphasize the mathematical relationship and assumptions. CIE often requires students to evaluate the model's limitations compared to more modern growth theories.
Related diagrams
Ask Otti about this diagram
Our AI tutor can walk you through every curve, explain exam technique, and quiz you on it.