Circular Flow with Leakages and Injections
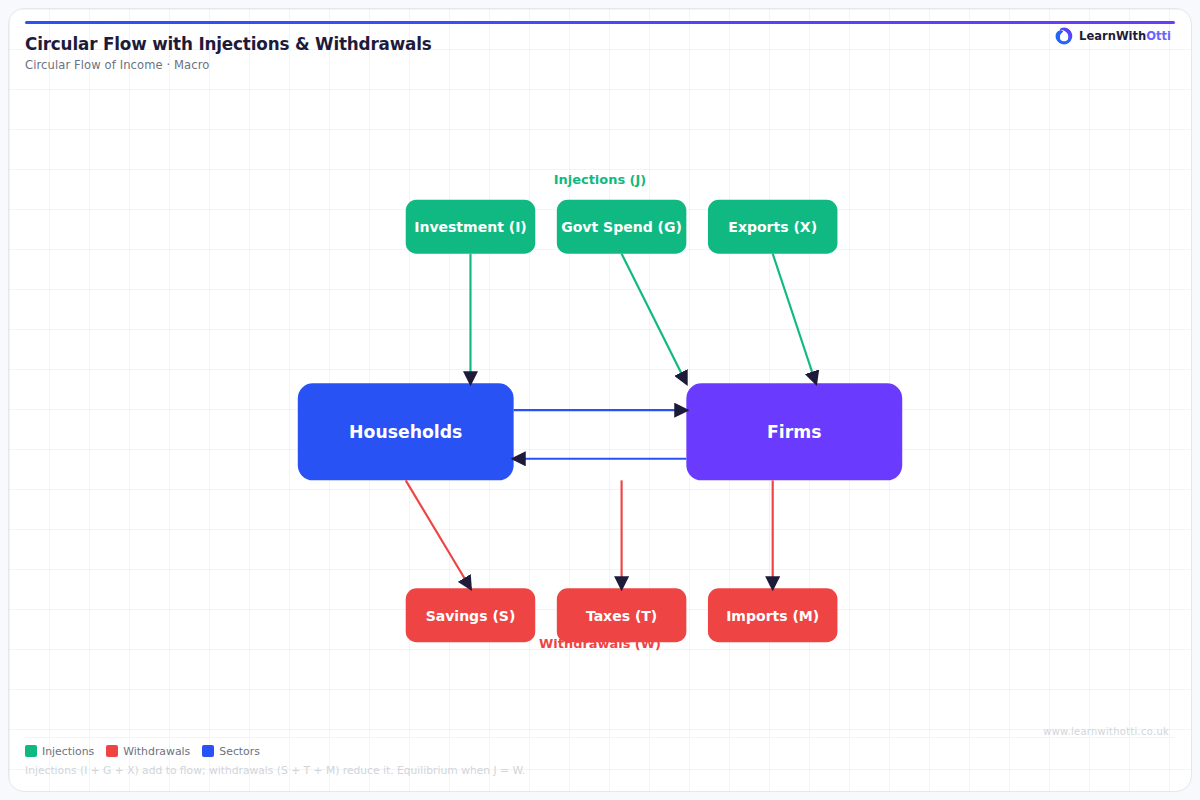
Five-sector circular flow diagram showing leakages (savings, taxes, imports) and injections (investment, government spending, exports) and their effect on national income.
Printable preview
Download a static PNG of this diagram to print or include in revision notes.
Download PNGWhat this diagram shows
The circular flow with leakages and injections shows how money moves around the economy between households and firms, but also how money leaves the system (leakages) and enters it (injections). Leakages include savings, taxes, and imports, while injections include investment, government spending, and exports. This diagram is crucial for understanding how national income is determined and how government policy can influence economic growth. It forms the foundation for understanding multiplier effects and macroeconomic equilibrium.
Key points
- Leakages (S + T + M) represent money flowing out of the circular flow - savings, taxes, and imports
- Injections (I + G + X) represent money flowing into the circular flow - investment, government spending, and exports
- When injections equal leakages, the economy is in equilibrium with stable national income
- If injections exceed leakages, national income rises (economic growth); if leakages exceed injections, national income falls (economic contraction)
- The multiplier effect means initial changes in injections or leakages have magnified impacts on final national income
Exam tip
Students often forget that leakages and injections must balance for equilibrium - if leakages exceed injections, the economy contracts, and vice versa. Examiners are impressed when you explicitly link the circular flow to multiplier effects and explain how changes in one injection or leakage ripple through the entire economy.
Common mistakes
Students frequently confuse which flows are leakages versus injections, particularly getting imports and exports mixed up. They also often forget that the diagram shows flows of money, not just goods and services, leading to confusion about the direction of arrows.
Exam board notes
All major exam boards treat this diagram identically, though OCR places slightly more emphasis on the mathematical relationship between leakages and injections in their calculations. AQA and Edexcel tend to focus more on the policy implications of the circular flow model.
Related diagrams
Ask Otti about this diagram
Our AI tutor can walk you through every curve, explain exam technique, and quiz you on it.