The Keynesian Multiplier Effect
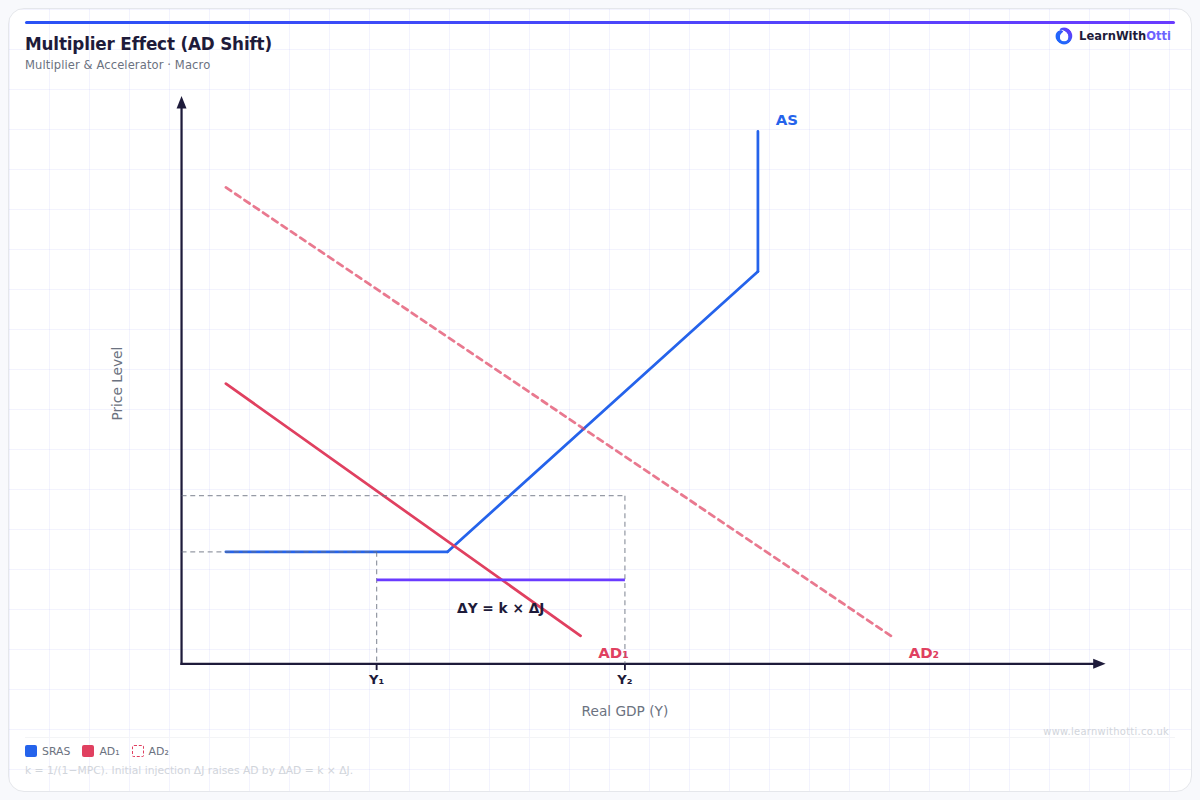
Diagram illustrating the Keynesian multiplier: an initial injection of spending is magnified through successive rounds of consumption, producing a larger final change in GDP.
Printable preview
Download a static PNG of this diagram to print or include in revision notes.
Download PNGWhat this diagram shows
The Keynesian multiplier effect diagram shows how an initial injection of government spending creates a larger overall increase in national income (GDP). When the government spends £1 billion on infrastructure, this money flows through the economy as workers spend their wages, creating additional rounds of spending. The diagram typically shows the rounds of spending getting smaller due to withdrawals, but demonstrates how the total impact on GDP exceeds the original government injection.
Key points
- The multiplier effect shows that initial government spending (injection) leads to a larger overall increase in national income
- Each round of spending generates income for others, but the effect diminishes due to withdrawals (savings, taxes, imports)
- The size of the multiplier depends on the marginal propensity to consume (MPC) - higher MPC means larger multiplier
- The multiplier formula is 1/(1-MPC) or 1/MPS, where MPS is the marginal propensity to save
- The effect works in reverse - spending cuts create negative multiplier effects that reduce GDP by more than the initial cut
Exam tip
Examiners are impressed when students explain that the multiplier effect works in both directions - cuts in government spending have a negative multiplier effect that reduces GDP by more than the initial spending reduction. Many students forget to mention the withdrawals (savings, taxes, imports) that determine the size of the multiplier.
Common mistakes
Students often confuse the multiplier with simple addition, failing to understand that it's the total cumulative effect of multiple rounds of spending. They also frequently forget that the multiplier applies to all injections and withdrawals, not just government spending.
Exam board notes
All major exam boards treat this diagram identically, though OCR tends to place slightly more emphasis on calculating multiplier values using the formula. Edexcel occasionally links it more explicitly to accelerator effects in their specifications.
Related diagrams
Ask Otti about this diagram
Our AI tutor can walk you through every curve, explain exam technique, and quiz you on it.