Accelerator Effect
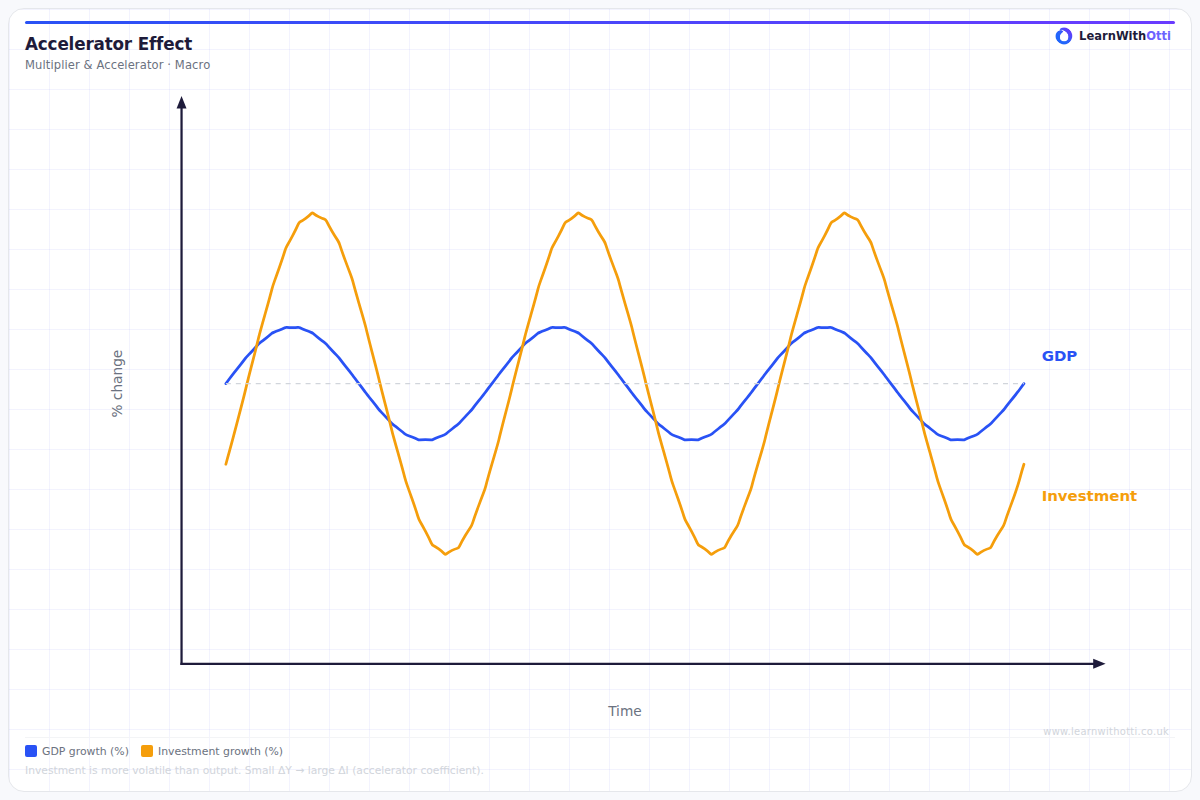
Diagram showing the accelerator principle: investment responds more than proportionally to changes in national income, amplifying cyclical fluctuations.
Printable preview
Download a static PNG of this diagram to print or include in revision notes.
Download PNGWhat this diagram shows
The accelerator effect diagram demonstrates how small changes in consumer demand can trigger much larger changes in business investment spending. When demand for goods increases, firms need more capital equipment to meet this demand, leading to a disproportionate increase in investment. This creates a multiplied impact on economic growth, but also means that when demand growth slows or falls, investment can collapse dramatically, amplifying economic downturns.
Key points
- The accelerator ratio shows the relationship between changes in output/demand and the resulting change in investment (typically 2:1 or 3:1)
- Works in both directions: rising demand causes investment booms, but slowing demand growth causes investment to fall sharply
- Explains why investment is the most volatile component of aggregate demand in economic cycles
- Time lags are crucial - there's usually a delay between demand changes and investment responses
- The effect is strongest in capital-intensive industries where machinery and equipment needs are high
Exam tip
Students often confuse the accelerator with the multiplier - remember the accelerator specifically shows how changes in demand lead to amplified changes in investment, not just any economic variable. Examiners are impressed when you can explain the numerical relationship and show understanding that the accelerator works in both directions (investment falls faster when demand growth slows).
Common mistakes
Students frequently mix up the accelerator with the multiplier effect, failing to recognize that the accelerator specifically deals with investment responses to demand changes. They also often miss that the accelerator can cause investment to fall even when demand is still rising, just at a slower rate.
Exam board notes
All major exam boards treat this diagram identically, focusing on the mathematical relationship between demand changes and investment responses. Some specifications place greater emphasis on linking the accelerator to business cycle analysis and fiscal policy effectiveness.
Related diagrams
Ask Otti about this diagram
Our AI tutor can walk you through every curve, explain exam technique, and quiz you on it.