Balance of Payments Structure
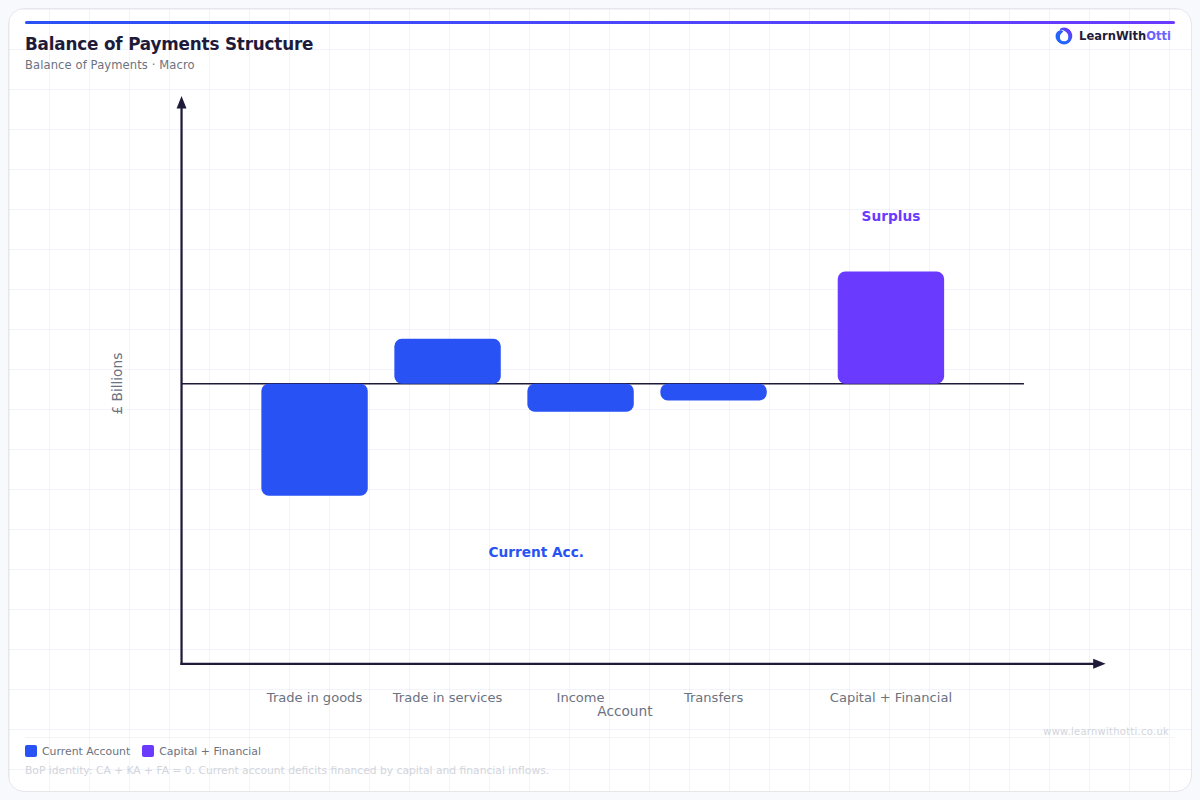
Diagram showing the structure of the balance of payments: current account (trade in goods and services, income, transfers) and capital/financial account and their interrelationship.
Printable preview
Download a static PNG of this diagram to print or include in revision notes.
Download PNGWhat this diagram shows
The Balance of Payments Structure diagram shows how a country's international transactions are systematically recorded across different accounts. It demonstrates the three main components: the current account (trade in goods/services and income flows), the capital account (asset transfers and acquisitions), and the financial account (investment flows and reserve changes). Understanding this structure is crucial because it shows how money flows between countries affect exchange rates and economic policy decisions.
Key points
- Current account records trade in goods (visible trade), services (invisible trade), primary income (investment returns), and secondary income (transfers)
- Capital account covers transfers of non-financial assets and acquisitions/disposals of non-produced assets
- Financial account tracks investment flows including direct investment, portfolio investment, and changes in official reserves
- The three accounts must sum to zero in theory - any deficit in one area must be offset by surpluses elsewhere
- Persistent current account deficits often require financing through capital/financial account surpluses, affecting exchange rates
Exam tip
Students often confuse the current and capital accounts - remember that the current account includes trade in goods and services plus income flows, while the capital account covers asset transfers and financial investments. Examiners are impressed when you can explain how these accounts must balance mathematically (surpluses in one offset deficits in another).
Common mistakes
Students frequently mix up the current and capital accounts, incorrectly placing foreign direct investment in the current account instead of the financial account. They also forget that the accounts must balance mathematically, leading to incomplete analysis of how deficits are financed.
Exam board notes
All major exam boards treat this diagram identically, though OCR places slightly more emphasis on the mathematical balancing relationship between accounts. AQA and Edexcel focus more on the practical implications for exchange rate determination.
Related diagrams
Ask Otti about this diagram
Our AI tutor can walk you through every curve, explain exam technique, and quiz you on it.