J-Curve Effect
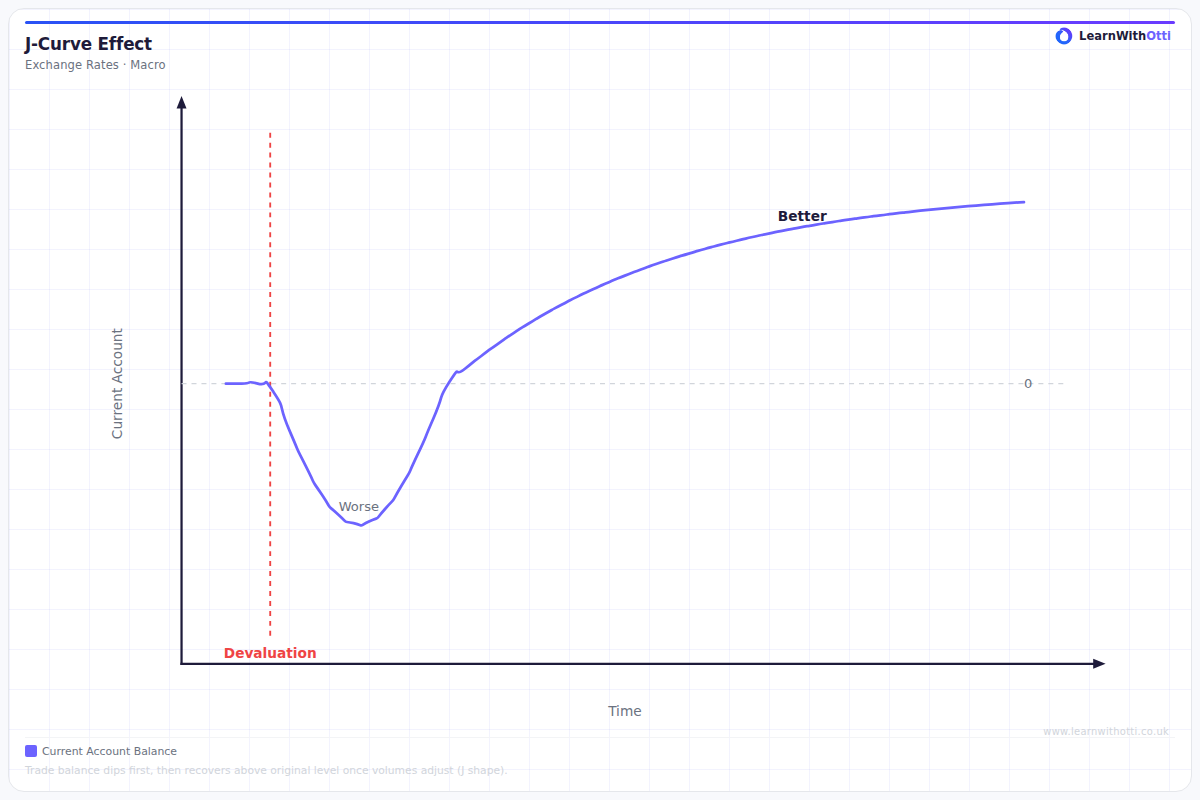
Time-series diagram showing the J-curve effect: after a currency depreciation the current account initially worsens before improving, as trade volumes adjust with a lag.
Printable preview
Download a static PNG of this diagram to print or include in revision notes.
Download PNGWhat this diagram shows
The J-Curve Effect shows what happens to a country's trade balance immediately after a currency depreciation. In the short run, the trade balance actually worsens (forming the downward part of the 'J'), before improving in the long run (the upward part). This occurs because import prices rise immediately when the currency weakens, but the quantity of imports and exports takes time to adjust due to existing contracts and consumer habits.
Key points
- Currency depreciation initially worsens the trade balance due to higher import prices with unchanged quantities
- Export revenues may fall initially as foreign buyers are slow to respond to lower prices in their currency
- The Marshall-Lerner condition must be met for long-term improvement: sum of price elasticities of demand for imports and exports > 1
- Time lags exist due to recognition lags (noticing price changes), decision lags (deciding to switch suppliers), and delivery lags (fulfilling new contracts)
- The curve eventually rises as consumers switch to cheaper domestic goods and foreigners buy more exports
Exam tip
Students often fail to explain the time dimension clearly - examiners want to see you distinguish between short-run elastic demand and long-run price elastic demand for exports/imports. Always explain that the initial worsening occurs because existing contracts can't be changed immediately, but over time consumers and businesses adjust their purchasing patterns.
Common mistakes
Students frequently assume the trade balance improves immediately after depreciation, missing the crucial short-run worsening effect. They also fail to explain why the adjustment takes time, not realizing that existing contracts and consumer behavior don't change instantly.
Exam board notes
All major exam boards treat this diagram identically, requiring understanding of both the short-run deterioration and long-run improvement phases. Some specifications emphasize the Marshall-Lerner condition more heavily than others, but the core J-curve concept remains consistent across all boards.
Related diagrams
Ask Otti about this diagram
Our AI tutor can walk you through every curve, explain exam technique, and quiz you on it.