UK's top import sources: 1960 and 2023
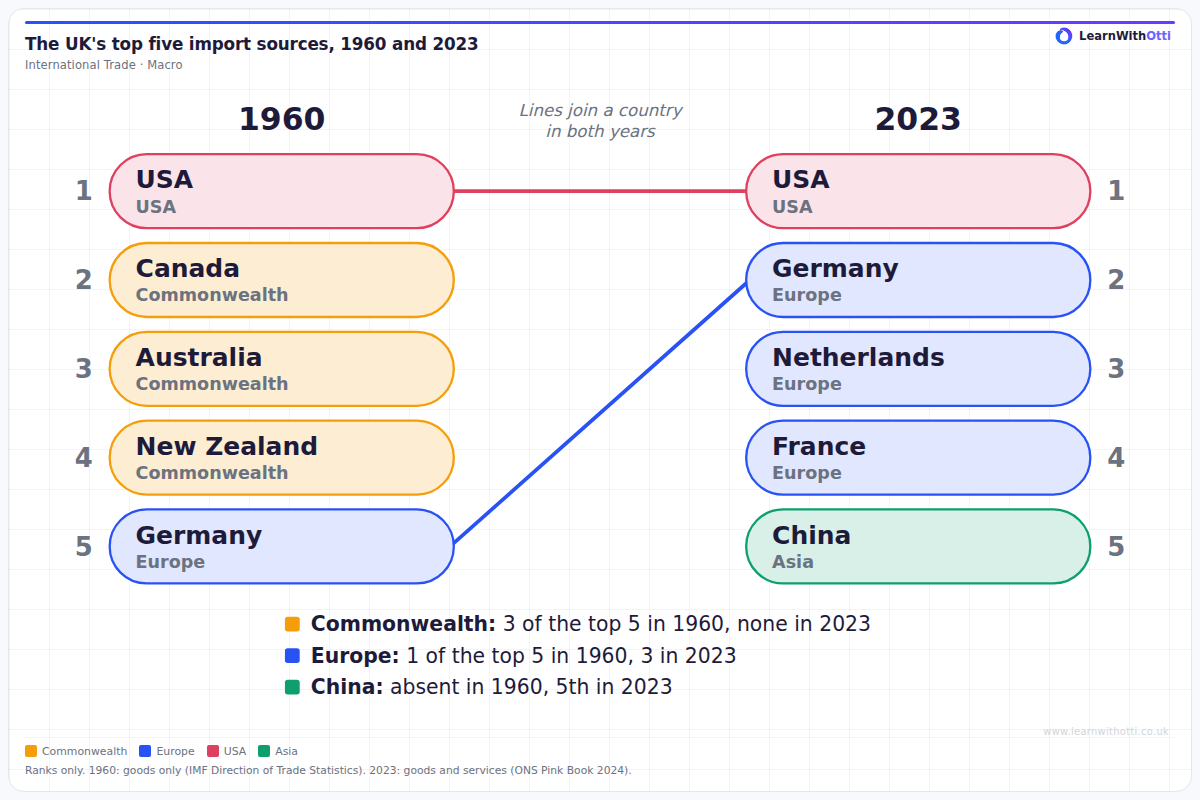
Ranked comparison of the UK's top five import sources in 1960 (USA, Canada, Australia, New Zealand, Germany) and 2023 (USA, Germany, Netherlands, France, China), grouped as Commonwealth, Europe, USA and Asia. Ranks only, because 1960 covers goods and 2023 covers goods and services.
Printable preview
Download a static PNG of this diagram to print or include in revision notes.
Download PNGWhat this diagram shows
This diagram compares the UK's top five sources of imports in 1960 and 2023, ranked from 1 at the top to 5 at the bottom. In 1960 the top five were the USA, Canada, Australia, New Zealand and Germany. In 2023 they were the USA, Germany, the Netherlands, France and China. Each country is coloured and labelled by group: Commonwealth, Europe, USA or Asia. Lines join the two countries that appear in both years: the USA stays 1st, and Germany rises from 5th to 2nd. Three Commonwealth countries were in the top five in 1960 and none are in 2023; one European country was in the top five in 1960 and three are in 2023; and China, absent in 1960, is 5th in 2023. The diagram shows ranks only, because the 1960 figures cover goods only (IMF Direction of Trade Statistics) while the 2023 figures cover goods and services (ONS Pink Book 2024), so the values themselves are not comparable.
Key points
- In 1960 the UK's top five import sources were the USA, Canada, Australia, New Zealand and Germany.
- In 2023 the UK's top five import sources were the USA, Germany, the Netherlands, France and China.
- The USA was the UK's largest import source in both years.
- Commonwealth countries held three of the top five places in 1960 and none in 2023.
- European countries held one of the top five places in 1960 and three in 2023, with Germany rising from 5th to 2nd.
- China was not in the top five in 1960 and was 5th in 2023.
- Only the ranks can be compared, because the 1960 ranking covers goods only and the 2023 ranking covers goods and services.
Exam tip
When you use this diagram, describe the change first and then explain it with a driver of the pattern of trade. The fall of Canada, Australia and New Zealand out of the top five and the rise of Germany, the Netherlands and France fit the UK joining the EEC in 1973, which removed barriers with European countries. China's arrival at 5th fits the entry of a large, lower-cost producer into world trade after it joined the WTO in 2001. Compare ranks only: the 1960 ranking covers goods and the 2023 ranking covers goods and services, so the two years are not measured on the same basis.
Common mistakes
A common mistake is to read the diagram as showing how much the UK imports from each country. It shows ranks only, and the two years are measured on different bases (goods only in 1960, goods and services in 2023), so it cannot show whether imports from any country rose or fell in value. Another is to say the UK stopped trading with the Commonwealth: Canada, Australia and New Zealand simply fell out of the top five. A third is to describe the change without explaining it; the shift towards Europe and China is an example of the pattern of trade changing as trading agreements and comparative advantage change.
Related diagrams
Ask Otti about this diagram
Our AI tutor can walk you through every curve, explain exam technique, and quiz you on it.