Movement Along the Supply Curve (Extension and Contraction)
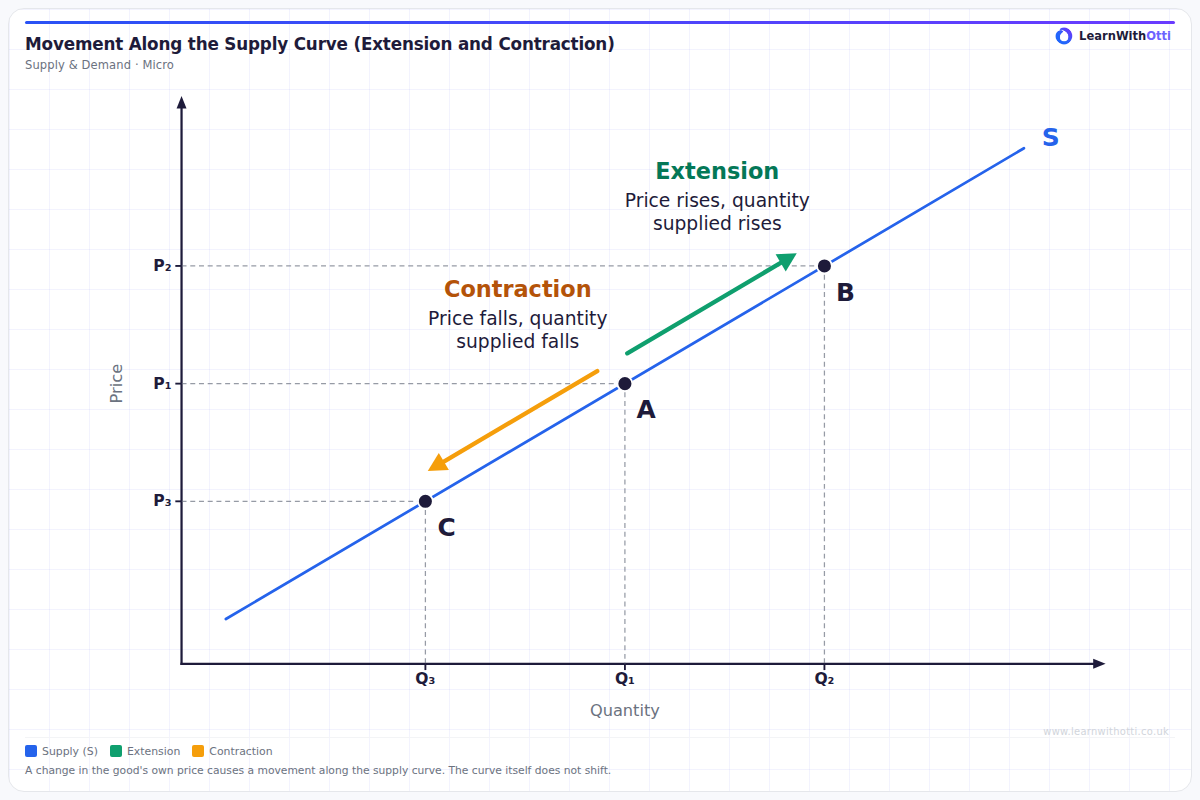
A single upward-sloping supply curve with three points: a rise in the good's own price moves from A up the curve to B (an extension of supply), and a fall moves from A down the curve to C (a contraction of supply). The curve itself does not shift.
Printable preview
Download a static PNG of this diagram to print or include in revision notes.
Download PNGWhat this diagram shows
This diagram shows a single supply curve, S, and what happens when the price of the good itself changes. The market starts at point A, with price P1 and quantity supplied Q1. If the price rises to P2, producers move up the curve to point B and the quantity supplied rises to Q2: this is an extension of supply. If the price falls to P3, producers move down the curve to point C and the quantity supplied falls to Q3: this is a contraction of supply. In both cases the curve itself stays where it is. Only a change in the good's own price causes a movement along the supply curve. A change in any of the conditions of supply, such as costs of production, technology, indirect taxes or subsidies, shifts the whole curve to the left or right instead.
Key points
- Only a change in the good's own price causes a movement along the supply curve.
- A rise in price causes an extension of supply: a movement up the curve to a higher quantity supplied.
- A fall in price causes a contraction of supply: a movement down the curve to a lower quantity supplied.
- A movement along the curve is a change in quantity supplied, not a change in supply.
- Changes in the conditions of supply, such as costs of production, technology, indirect taxes or subsidies, shift the supply curve instead of causing a movement along it.
- The movement follows the law of supply: price and quantity supplied move in the same direction, because a higher price makes it more profitable to produce more.
Exam tip
When you use this diagram, start by naming the cause. If the good's own price has changed, the answer is a movement along the existing supply curve: a rise in price is an extension of supply and a fall in price is a contraction of supply. Use the words "quantity supplied" for a movement along the curve, and keep the word "supply" for the whole curve. If anything else has changed, such as costs of production or technology, draw a shift of the curve instead.
Common mistakes
The most common mistake is to shift the supply curve when the good's own price changes. A change in the good's own price only moves the market along the existing curve; the curve shifts only when a condition of supply changes. Another is to mix up the terms: a rise in price causes an extension (quantity supplied rises), a fall in price causes a contraction (quantity supplied falls). A third is to say "supply rises" for an extension; strictly, the quantity supplied rises, and "an increase in supply" means the whole curve has shifted to the right.
Related diagrams
Ask Otti about this diagram
Our AI tutor can walk you through every curve, explain exam technique, and quiz you on it.