X-Inefficiency
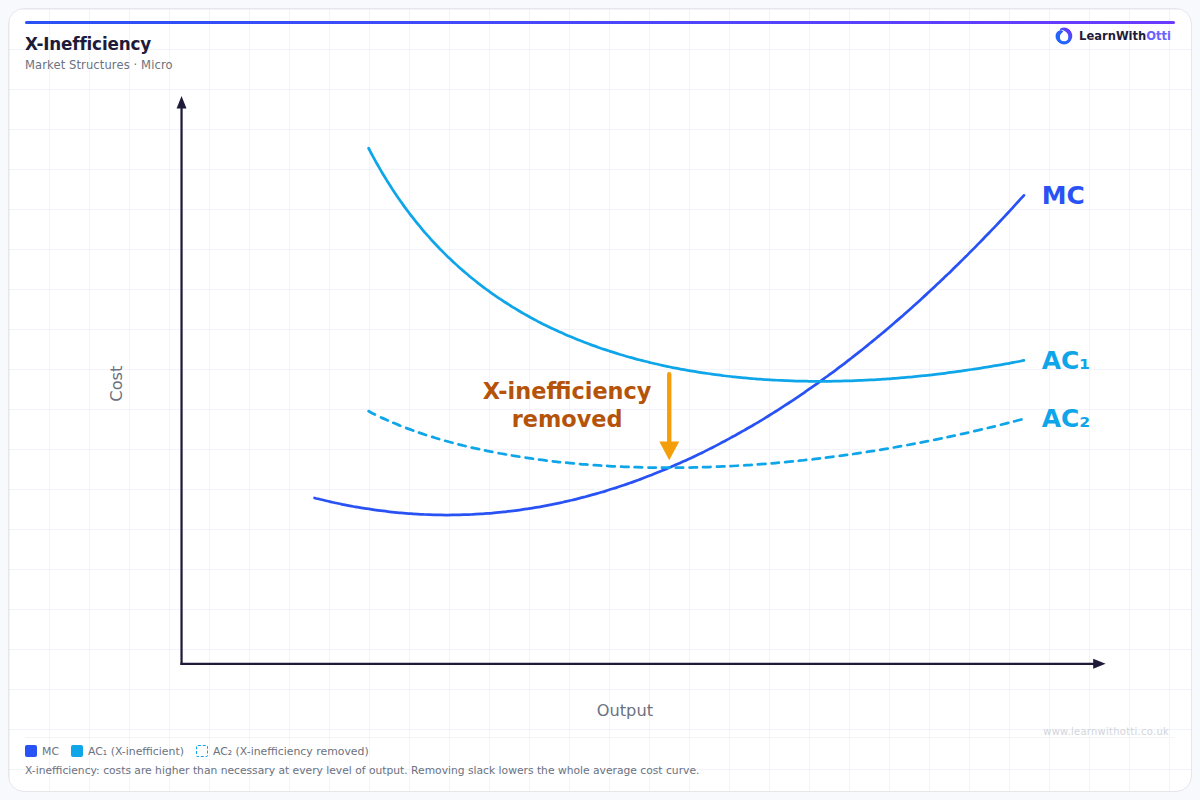
One marginal cost curve and two U-shaped average cost curves: AC1 includes organisational slack and lies above AC2 at every output, and removing the slack lowers the whole AC curve to AC2. MC cuts each AC curve at its minimum.
Printable preview
Download a static PNG of this diagram to print or include in revision notes.
Download PNGWhat this diagram shows
This diagram shows X-inefficiency: costs that are higher than the lowest possible cost of producing a given level of output. AC1 is the average cost curve of a firm with organisational slack, such as overstaffing, wasteful overheads or poor management. AC2 is the average cost curve once that slack is removed. Because the slack does not vary with output, AC1 lies above AC2 at every level of output, and removing it lowers the whole curve, shown by the arrow. Marginal cost is the same for both, because the slack does not change with output, so there is one MC curve, and it cuts each AC curve at that curve's minimum. X-inefficiency is most likely where competitive pressure is weak, for example in a monopoly or a state-owned firm, because there are no rivals to undercut a firm whose costs are higher than they need to be. It is a different idea from productive inefficiency: a firm can produce at the minimum of AC1 and still be X-inefficient, because the whole curve is higher than it needs to be.
Key points
- X-inefficiency means costs are above the lowest possible cost for a given level of output.
- It is caused by organisational slack, such as overstaffing, wasteful overheads or poor management.
- It is most likely where competitive pressure is weak, for example in a monopoly or a state-owned firm.
- It is shown as a whole AC curve that is too high (AC1), not as a point on the wrong part of a single AC curve.
- Removing the slack lowers the whole AC curve, from AC1 to AC2.
- Slack that does not vary with output leaves marginal cost unchanged, so one MC curve cuts both AC curves at their minimum points.
Exam tip
Show X-inefficiency as a whole average cost curve that is too high, not as a point on the wrong part of a single AC curve. Draw the X-inefficient AC curve above the efficient one at every output, and use one MC curve that cuts each AC curve at its minimum. Then explain the cause: organisational slack, which is most likely where competitive pressure is weak.
Common mistakes
The most common mistake is to show X-inefficiency as a point on a single AC curve, away from its minimum. That is productive inefficiency. X-inefficiency is a whole AC curve that is higher than it needs to be at every level of output. Another is to confuse X-inefficiency with diseconomies of scale: diseconomies are rising long-run average cost as a firm grows, whereas X-inefficiency is wasted cost at any size. A third is to draw a separate MC curve for each AC curve. Slack that does not vary with output does not change marginal cost, so the same MC curve cuts both AC curves at their minimum points.
Related diagrams
Ask Otti about this diagram
Our AI tutor can walk you through every curve, explain exam technique, and quiz you on it.