Allocative and Productive Efficiency
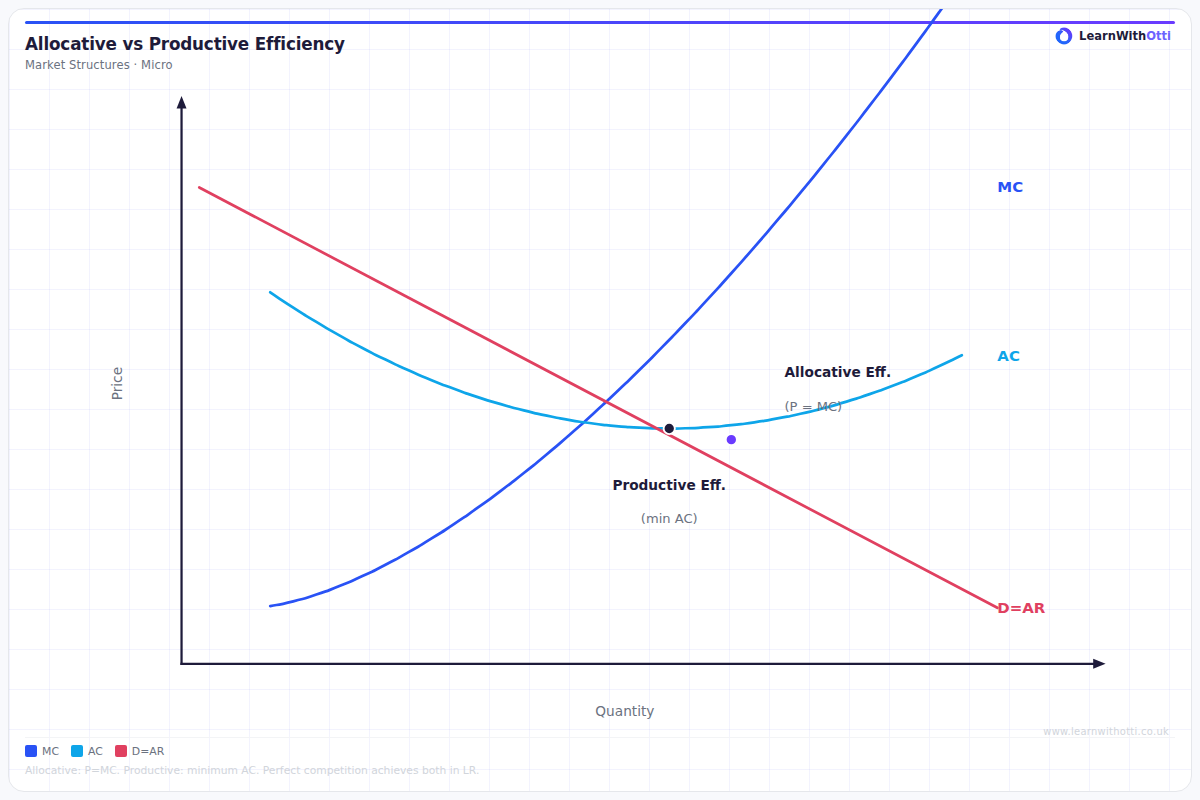
Diagram contrasting allocative efficiency (P = MC) and productive efficiency (P = min AC), showing where each is achieved and comparing market structures.
Printable preview
Download a static PNG of this diagram to print or include in revision notes.
Download PNGWhat this diagram shows
This diagram illustrates two crucial concepts in market analysis: allocative efficiency (where price equals marginal cost, P=MC) and productive efficiency (where firms produce at minimum average cost). These efficiencies are rarely achieved simultaneously in real markets, creating trade-offs that help explain why different market structures perform differently. Understanding these concepts is essential for evaluating market performance and government intervention policies.
Key points
- Allocative efficiency occurs when P=MC, ensuring resources are allocated to their most valued uses and consumer welfare is maximised
- Productive efficiency occurs at the minimum point of the average cost curve, where firms produce at lowest possible cost per unit
- Perfect competition achieves both efficiencies in long-run equilibrium, while monopolies typically achieve neither
- There's often a trade-off between the two efficiencies - firms may need to be large (productively efficient) but this can reduce competition (allocatively inefficient)
- Dynamic efficiency (innovation and investment) may require short-term allocative inefficiency but leads to long-term consumer benefits
Exam tip
Examiners love when students clearly distinguish between the two types of efficiency and explain WHY they matter for different market structures. Always remember that productive efficiency occurs at the lowest point of the AC curve, while allocative efficiency occurs where P=MC - don't confuse these conditions!
Common mistakes
Students frequently confuse the conditions for each efficiency type, incorrectly stating that allocative efficiency requires minimum AC rather than P=MC. They also often forget that achieving both efficiencies simultaneously is rare in practice and fail to explain the trade-offs between them.
Exam board notes
All major exam boards treat this diagram identically, though OCR places slightly more emphasis on dynamic efficiency concepts. AQA and Edexcel questions often link these efficiencies directly to market structure evaluation questions.
Related diagrams
Ask Otti about this diagram
Our AI tutor can walk you through every curve, explain exam technique, and quiz you on it.