Profit Maximisation (MR = MC)
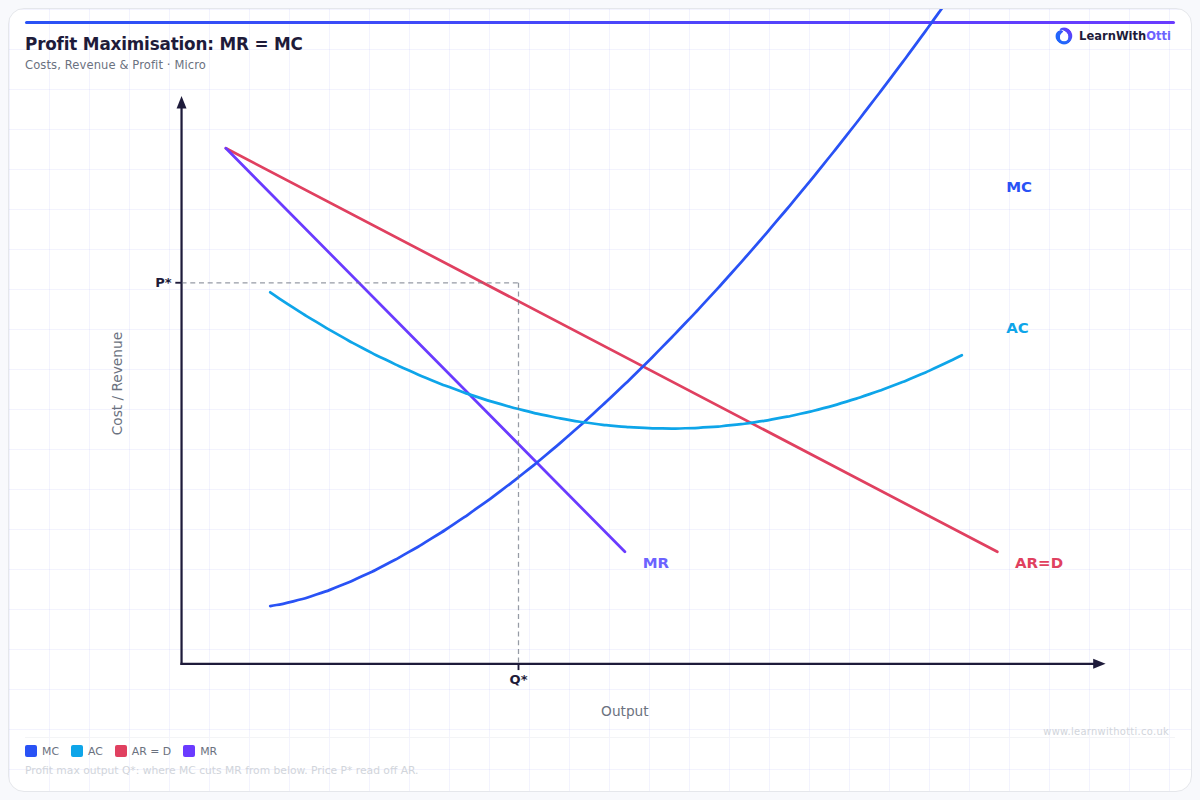
Diagram showing the profit-maximising output where marginal revenue equals marginal cost (MR = MC), with the profit rectangle between AR and AC illustrated.
Printable preview
Download a static PNG of this diagram to print or include in revision notes.
Download PNGWhat this diagram shows
This diagram shows how firms determine their profit-maximising output level by producing where marginal revenue equals marginal cost (MR = MC). At this point, the additional revenue from selling one more unit exactly equals the additional cost of producing it, meaning total profit cannot be increased further. This principle applies across all market structures and is fundamental to understanding firm behaviour. The diagram typically shows MC and MR curves intersecting, with the optimal quantity read off from this intersection point.
Key points
- Profit maximisation occurs where MR = MC - this is the golden rule for all firms
- To the left of MR = MC, firms should increase output as MR > MC (additional profit available)
- To the right of MR = MC, firms should decrease output as MC > MR (making losses on extra units)
- The price charged is found by reading up from the profit-maximising quantity to the demand curve
- Abnormal profit is shown by the area between average revenue and average cost at the profit-maximising output
Exam tip
Students often confuse profit maximisation with revenue maximisation - remember that MR = MC gives maximum profit, not maximum revenue. Examiners are impressed when you clearly explain that at any output below MR = MC, the firm could increase profit by producing more, and at any output above this point, additional units reduce total profit.
Common mistakes
Students frequently assume firms maximise revenue rather than profit, leading them to choose the wrong output level. Many also forget to read price from the demand curve, incorrectly taking it from where MR = MC instead.
Exam board notes
All major exam boards treat this diagram identically. The MR = MC rule is universally applied across AQA, Edexcel, OCR and CIE specifications as the fundamental profit maximisation condition.
Related diagrams
Ask Otti about this diagram
Our AI tutor can walk you through every curve, explain exam technique, and quiz you on it.