Breakeven and Shutdown Points
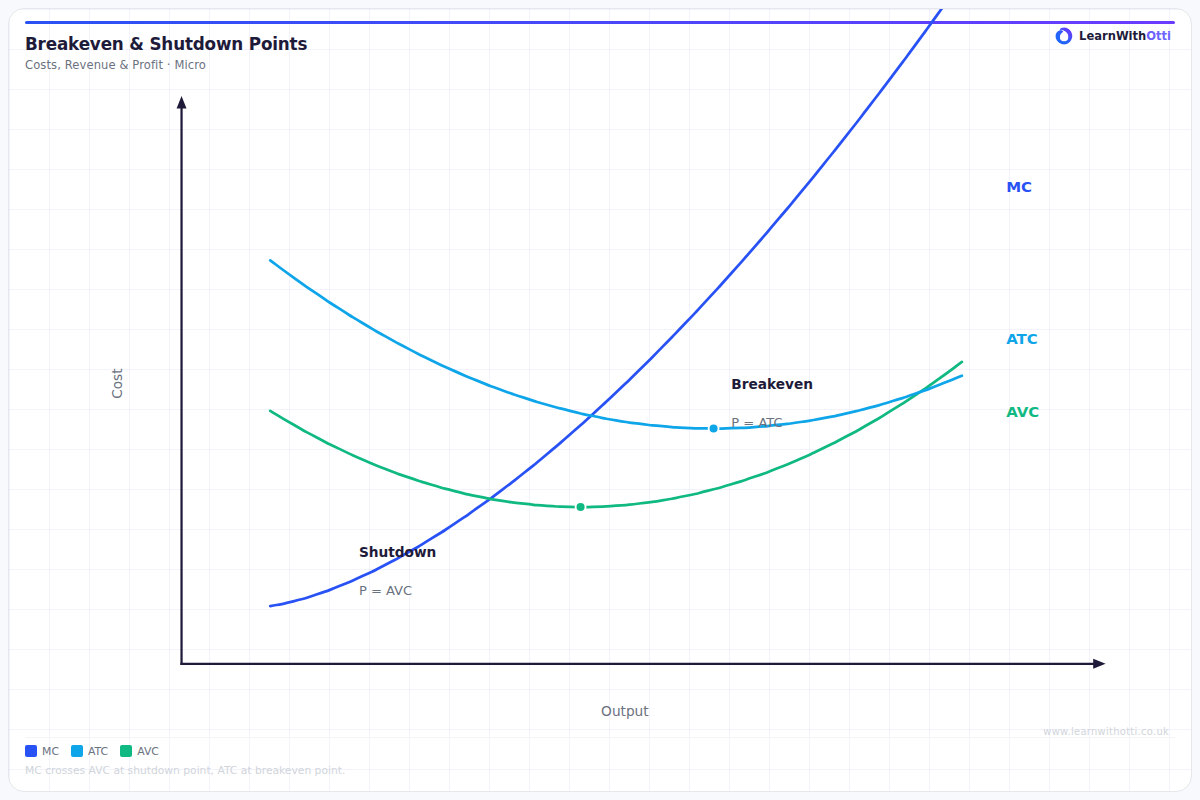
Diagram showing the breakeven point (P = AC) and the shutdown point (P = AVC) for a competitive firm, distinguishing short-run and long-run survival conditions.
Printable preview
Download a static PNG of this diagram to print or include in revision notes.
Download PNGWhat this diagram shows
This diagram shows the two crucial decision-making points for firms in the short run. The breakeven point occurs where average revenue equals average total cost, meaning the firm makes normal profit (zero economic profit). The shutdown point occurs where average revenue equals average variable cost - below this point, the firm loses more money by producing than by shutting down completely. Understanding these points helps explain why some loss-making firms continue operating while others close down.
Key points
- Breakeven point: AR = ATC, firm makes normal profit (zero economic profit)
- Shutdown point: AR = AVC, the minimum price needed to justify continued production
- Between shutdown and breakeven points: firm operates at a loss but covers variable costs plus some fixed costs
- Below shutdown point: firm loses more by producing than by closing, so should cease production
- Above breakeven point: firm makes supernormal profit and will definitely continue producing
Exam tip
Examiners love to see students clearly distinguish between the breakeven point (where AR = ATC) and the shutdown point (where AR = AVC). Many students confuse these two critical points - remember that firms can operate at a loss in the short run as long as they cover variable costs, but will shut down if they can't even do that.
Common mistakes
Students frequently mix up the breakeven and shutdown points, thinking firms shut down as soon as they make a loss. Remember that rational firms will continue operating at a loss in the short run as long as they can cover their variable costs and contribute something towards fixed costs.
Exam board notes
All major exam boards treat this diagram identically, though OCR occasionally emphasizes the mathematical relationship between these points and profit maximization more explicitly than other boards.
Related diagrams
Ask Otti about this diagram
Our AI tutor can walk you through every curve, explain exam technique, and quiz you on it.