Perfect Competition — Loss-Making Firm
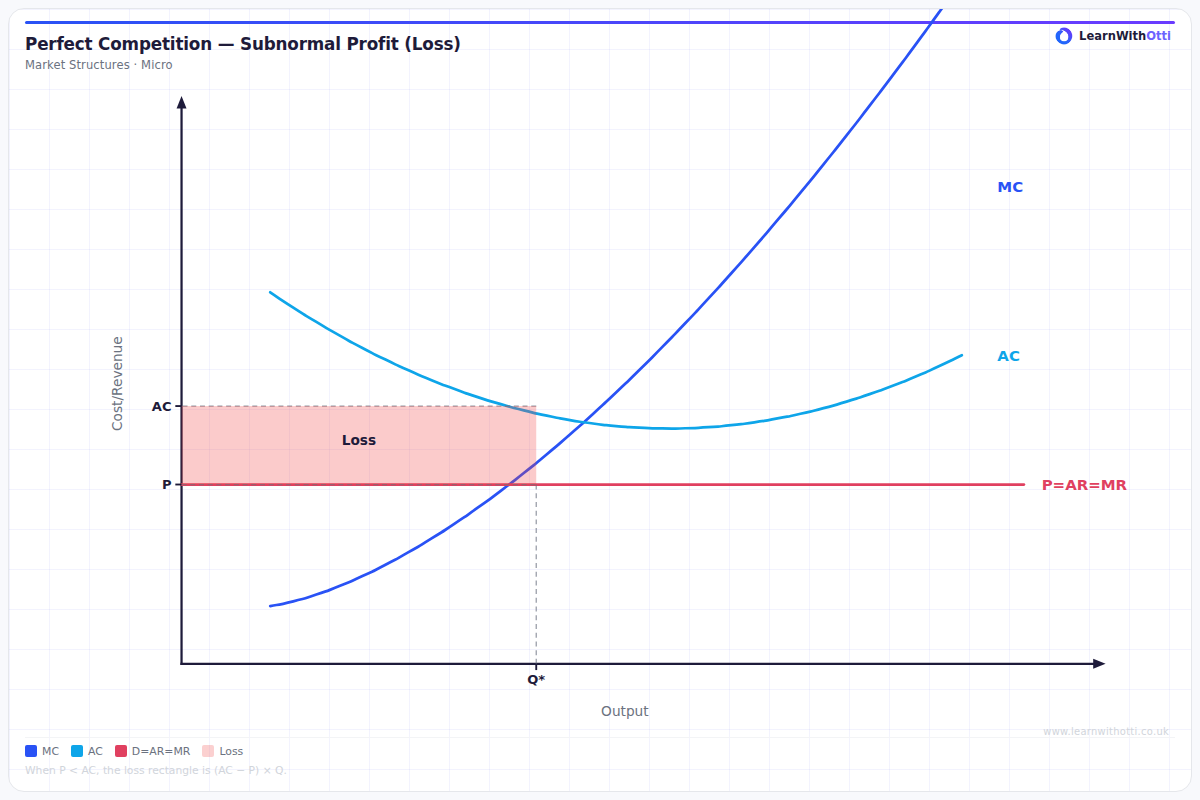
Diagram showing a perfectly competitive firm making a short-run loss (P < AC), with the loss rectangle illustrated and the decision to stay open while P > AVC.
Printable preview
Download a static PNG of this diagram to print or include in revision notes.
Download PNGWhat this diagram shows
This diagram shows a perfectly competitive firm making economic losses in the short run, where the market price falls below the firm's average total cost curve. The firm produces where marginal cost equals marginal revenue (the market price), but at this output level, average total cost exceeds price, creating a loss shown by the shaded rectangular area. Despite making losses, the rational firm continues operating because the price still covers average variable costs, meaning it can pay its variable costs and contribute something toward fixed costs. This situation demonstrates why firms might remain in markets temporarily even when unprofitable.
Key points
- The firm produces at the profit-maximising output where MC = MR = P, but makes losses because P < ATC at this quantity
- The loss per unit equals the vertical distance between price and ATC, with total losses shown as a rectangular area
- The firm continues operating in the short run because P > AVC - it covers variable costs and contributes to fixed costs
- If price fell below AVC, the firm would shut down immediately as it couldn't even cover its variable costs
- In the long run, if losses persist, firms will exit the industry, reducing supply and pushing prices back up toward break-even
Exam tip
Examiners are impressed when students clearly explain why the firm continues operating despite making losses - emphasise that as long as price covers average variable costs, the firm minimises losses by continuing production. Students often forget to explain the difference between short-run losses (acceptable) and long-run exit decisions.
Common mistakes
Students frequently confuse 'making losses' with 'shutting down' - remember that loss-making firms continue operating if they cover variable costs. Another common error is incorrectly identifying the loss area or forgetting to explain why the firm doesn't immediately exit the market.
Exam board notes
All major exam boards treat this diagram identically, focusing on the short-run versus long-run distinction and the shutdown condition. Some specifications emphasise the dynamic adjustment process more heavily, particularly how losses lead to eventual industry exit and market adjustment.
Related diagrams
Ask Otti about this diagram
Our AI tutor can walk you through every curve, explain exam technique, and quiz you on it.