Asymmetric Information — Over-consumption
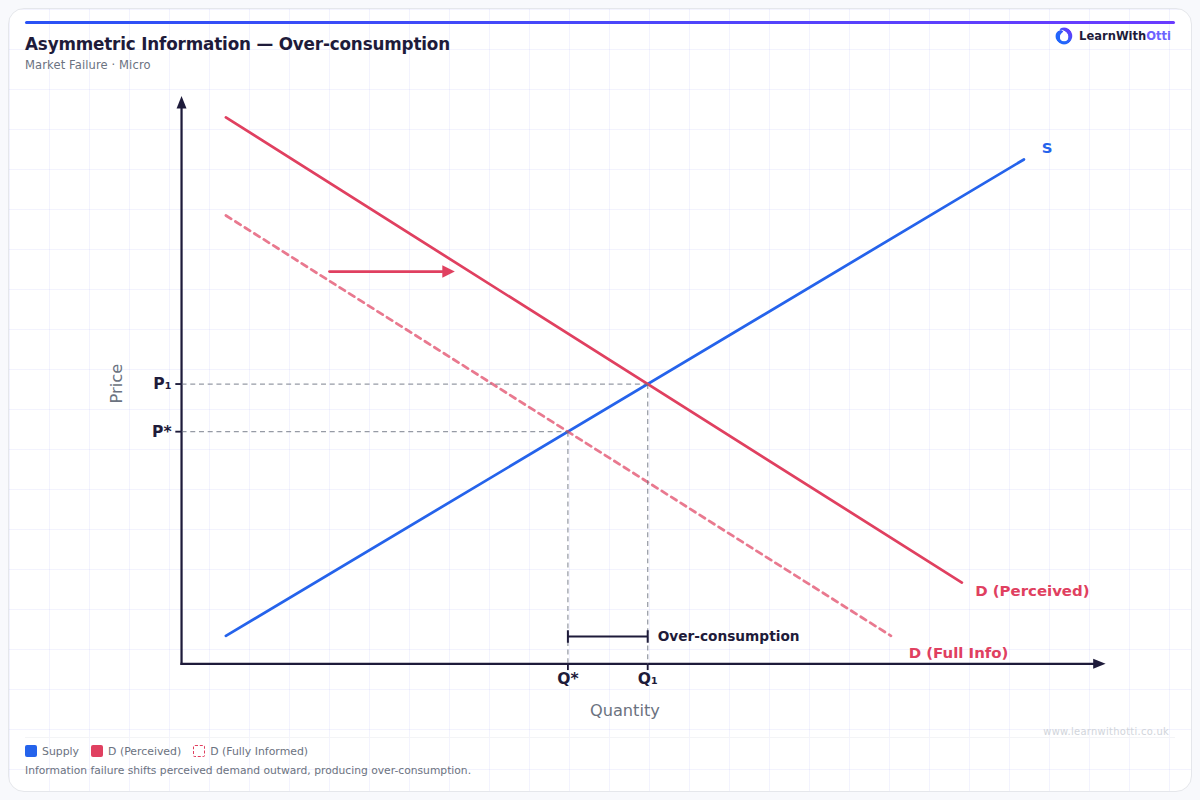
Diagram showing information failure where buyers overestimate a good's benefit: perceived demand lies to the right of fully informed demand, so the market over-consumes at Q₁ above the socially optimal Q*.
Printable preview
Download a static PNG of this diagram to print or include in revision notes.
Download PNGWhat this diagram shows
This diagram shows how asymmetric information can cause over-consumption. When the seller knows more about a product than the buyer, buyers may overestimate its benefit: for example, a second-hand car with hidden faults, a financial product with hidden charges, or a repair or treatment that is not actually needed. Perceived demand therefore lies to the right of the demand curve that would exist if buyers were fully informed. The market settles where perceived demand meets supply, at Q₁, which is above the socially optimal quantity Q*, where fully informed demand meets supply. The units between Q* and Q₁ cost more to produce than they are truly worth to buyers, so resources are misallocated and there is a welfare loss.
Key points
- Perceived demand, D (Perceived), lies to the right of fully informed demand, D (Full Info), because buyers overestimate the benefit of the good when the seller knows more than they do.
- The supply curve is unchanged: the distortion comes entirely from the demand side of the market.
- The market equilibrium is at Q₁ and P₁, where perceived demand meets supply; the socially optimal point is at Q* and P*, where fully informed demand meets supply.
- Because Q₁ is greater than Q*, the good is over-consumed, and buyers pay a higher price (P₁ rather than P*) than they would if they were fully informed.
- Seller-knows-more examples include second-hand cars with hidden faults, financial products with hidden charges, unnecessary repairs, and over-treatment by a private healthcare provider.
Exam tip
Say which party holds the extra information and why it pushes demand up: here the seller knows more, so buyers overestimate the benefit of the good. Then compare the two outcomes directly. Perceived demand meets supply at Q₁, fully informed demand meets supply at Q*, and the gap Q₁ − Q* is the over-consumption. If you go on to show the welfare loss, it is the triangle between the supply curve and fully informed demand from Q* to Q₁ (it is not shaded on this diagram).
Common mistakes
It is easy to assume that asymmetric information always causes under-consumption. When the seller knows more and buyers overestimate the benefit, perceived demand sits to the right of fully informed demand and the market over-consumes. Another mistake is to label the curves MPB and MSB: that is the language of externalities, whereas here the gap is between perceived and fully informed demand. Label both outcomes clearly, Q₁ for the market and Q* for the social optimum, so that the over-consumption gap is easy to see.
Related diagrams
Ask Otti about this diagram
Our AI tutor can walk you through every curve, explain exam technique, and quiz you on it.