Kinked Demand Curve Advanced
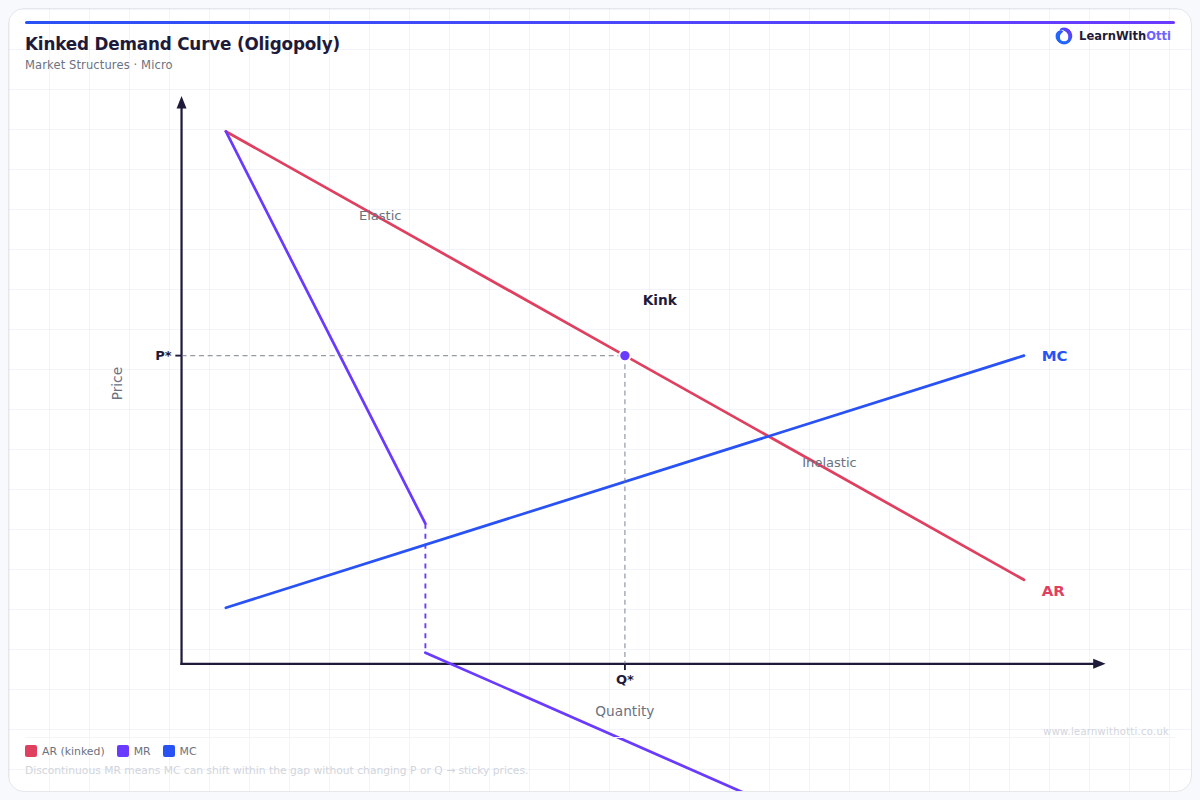
Sweezy's kinked demand curve model for oligopoly, explaining price rigidity: rivals match price cuts but not price rises, creating a kink and discontinuous MR curve.
Printable preview
Download a static PNG of this diagram to print or include in revision notes.
Download PNGWhat this diagram shows
The kinked demand curve model explains why prices in oligopolies tend to be 'sticky' or stable over time. The kink occurs at the current market price because firms believe competitors will react differently to price increases versus price decreases. Above the kink, demand is relatively elastic (competitors won't match price rises), while below the kink, demand is relatively inelastic (competitors will match price cuts). This creates a discontinuous marginal revenue curve with a vertical gap, meaning costs can change significantly without affecting the profit-maximizing price.
Key points
- The kink exists because firms assume asymmetric competitor responses: rivals ignore price increases but match price decreases
- Above the current price, demand is elastic as the firm loses customers to competitors who don't raise prices
- Below the current price, demand is inelastic as competitors match price cuts, preventing the firm from gaining market share
- The marginal revenue curve has a vertical discontinuity at the kinked point, creating a range where MC can fluctuate without changing optimal price
- This model explains price rigidity in oligopolistic markets and why non-price competition is often preferred
Exam tip
Examiners are impressed when students explain WHY the demand curve is kinked - that rivals match price cuts but ignore price rises. Many students just describe the shape without explaining the underlying game theory of competitive reactions that creates this kink.
Common mistakes
Students often draw the marginal revenue curve as continuous rather than showing the crucial vertical gap at the kink. They also frequently fail to explain that the model assumes specific competitor behavior patterns rather than actual observed reactions.
Exam board notes
All major exam boards treat this diagram identically, though OCR tends to emphasize the limitations of the model more heavily. Some specifications may require students to evaluate whether the kinked demand curve adequately explains real-world oligopoly behavior.
Related diagrams
Ask Otti about this diagram
Our AI tutor can walk you through every curve, explain exam technique, and quiz you on it.