Kinked Demand Curve Simple
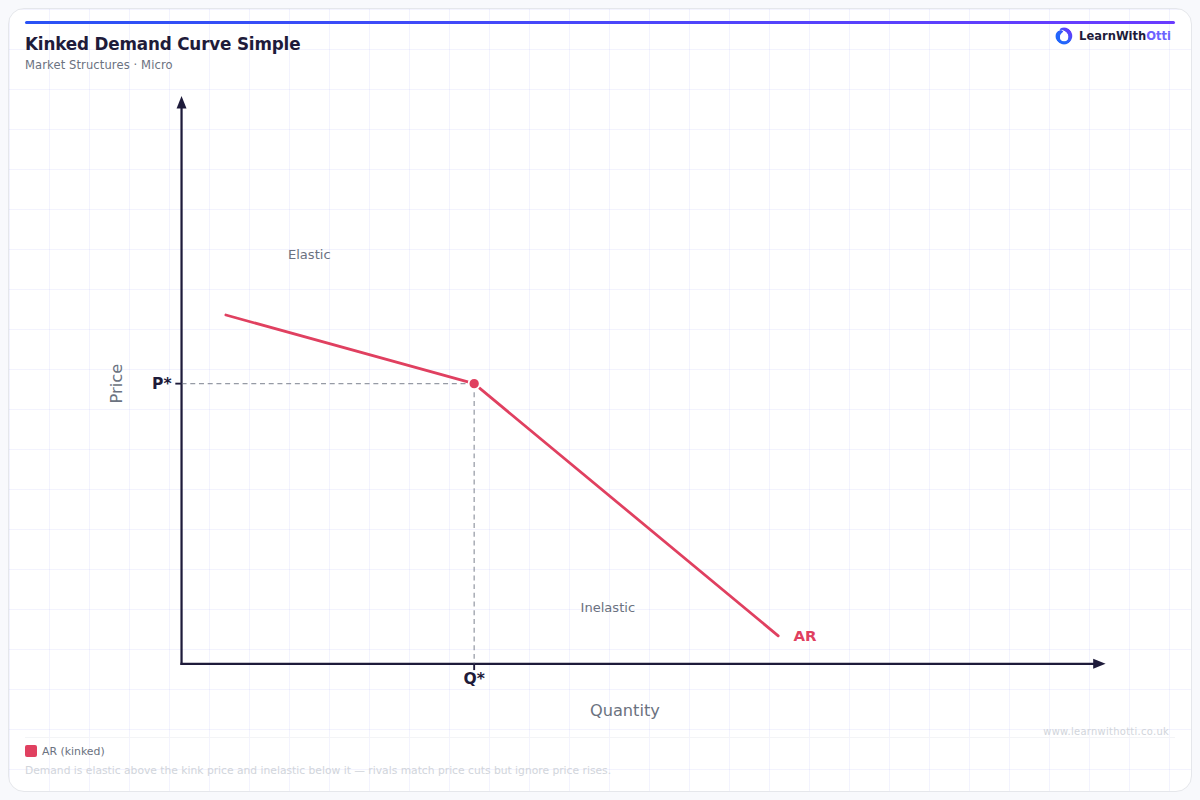
The kinked demand curve for oligopoly on its own: elastic above the kink price, inelastic below it, without the MR or MC construction.
Printable preview
Download a static PNG of this diagram to print or include in revision notes.
Download PNGWhat this diagram shows
This is the kinked demand curve on its own, isolating the shape that underpins the Sweezy model of oligopoly. The kink sits at the firm's current price. Above the kink, demand is relatively elastic because a price rise is not matched by rivals, so the firm loses significant market share. Below the kink, demand is relatively inelastic because rivals match any price cut, so the firm gains little extra quantity for the price it sacrifices. This asymmetry is what gives the demand curve its kinked shape rather than a single straight line.
Key points
- The kink occurs at the firm's existing price, marked P* on the diagram
- Above P*, demand is elastic: rivals ignore a price rise, so the firm loses customers quickly
- Below P*, demand is inelastic: rivals match a price cut, so quantity gained is limited
- The differing gradients either side of the kink reflect these two different competitor responses
- This shape is the starting point for the full model, which adds MR and MC to explain price rigidity
Exam tip
Examiners award marks for correctly explaining WHY the curve kinks, not just for drawing the shape. Always state the assumption about asymmetric competitor reactions before describing elastic and inelastic segments.
Common mistakes
Students often draw a smooth curve or a single straight line instead of a genuine kink with two distinct gradients. They also sometimes mislabel which segment is elastic and which is inelastic relative to the kink.
Exam board notes
All major exam boards expect the same core diagram. This simplified version is useful for building the shape before layering on MR and MC, which is where AQA, Edexcel, OCR and CIE questions tend to focus their marks.
Related diagrams
Ask Otti about this diagram
Our AI tutor can walk you through every curve, explain exam technique, and quiz you on it.