Price Elasticity of Supply — Inelastic
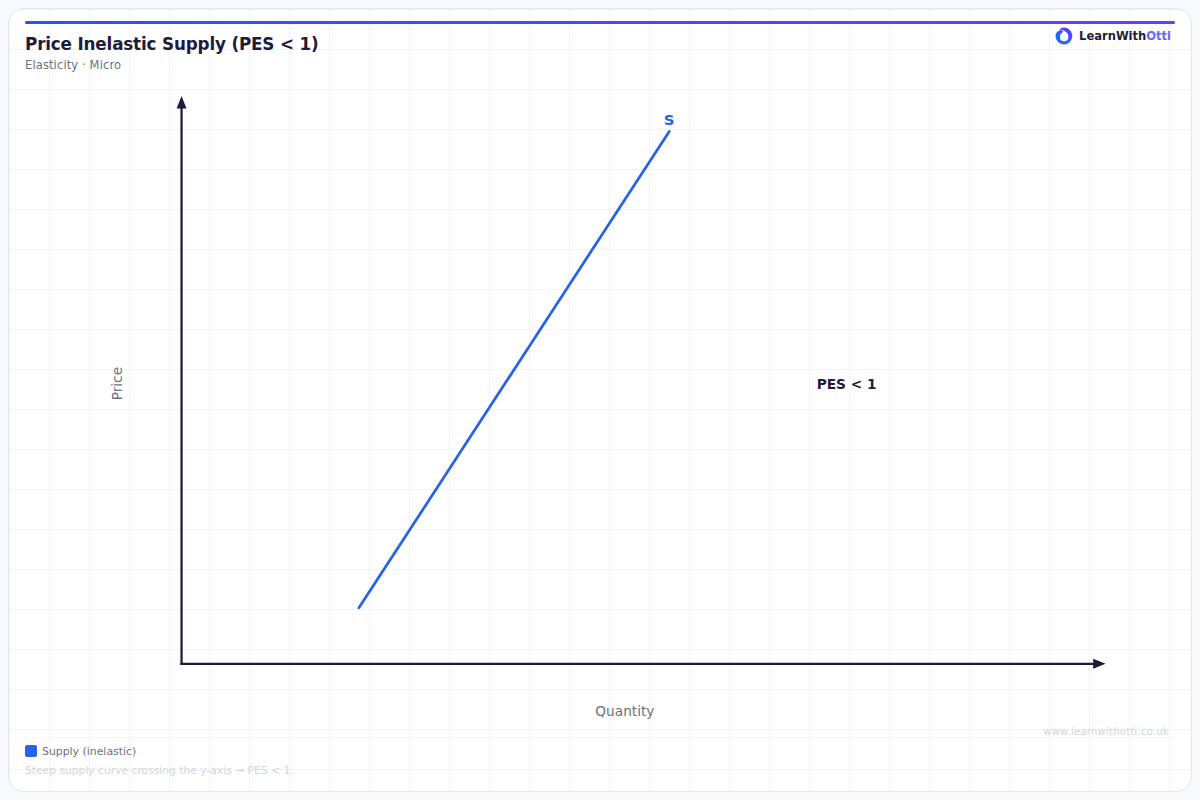
Supply curve with PES < 1 (inelastic), showing that quantity supplied responds less than proportionally to a price rise. Common with perishable or capacity-constrained goods.
Printable preview
Download a static PNG of this diagram to print or include in revision notes.
Download PNGWhat this diagram shows
This diagram shows inelastic supply, where the supply curve is relatively steep, indicating that quantity supplied is not very responsive to price changes. When supply is inelastic (PES < 1), producers find it difficult to increase output quickly even when prices rise, often due to constraints like limited factory capacity, scarce raw materials, or time-intensive production processes. This concept is crucial for understanding why some markets experience volatile prices - when supply cannot easily adjust to meet changing demand, prices tend to fluctuate more dramatically. Understanding supply elasticity helps explain real-world phenomena like housing shortages and agricultural price volatility.
Key points
- Supply curve is steep, showing PES coefficient is less than 1 (inelastic)
- Large price changes result in relatively small changes in quantity supplied
- Common causes include limited production capacity, scarce inputs, or time constraints in production
- Markets with inelastic supply often experience greater price volatility when demand shifts
- Examples include agricultural products in the short run, housing, and specialist skilled labour
Exam tip
Always quote the numerical coefficient when discussing inelastic supply - examiners love to see you can calculate and interpret PES values below 1. Remember that inelastic supply means producers cannot easily increase output even when prices rise significantly, so always link this back to real-world constraints like limited resources or production capacity.
Common mistakes
Students often confuse the steepness of the curve with the elasticity value, thinking a steep curve means 'more elastic' rather than inelastic. They also frequently forget to relate inelastic supply back to real-world production constraints and time periods.
Exam board notes
All major exam boards treat this diagram identically, though OCR tends to place slightly more emphasis on calculating numerical PES values while AQA focuses more on practical applications and evaluation of market outcomes.
Related diagrams
Ask Otti about this diagram
Our AI tutor can walk you through every curve, explain exam technique, and quiz you on it.