Price Elasticity of Supply — Perfectly Inelastic
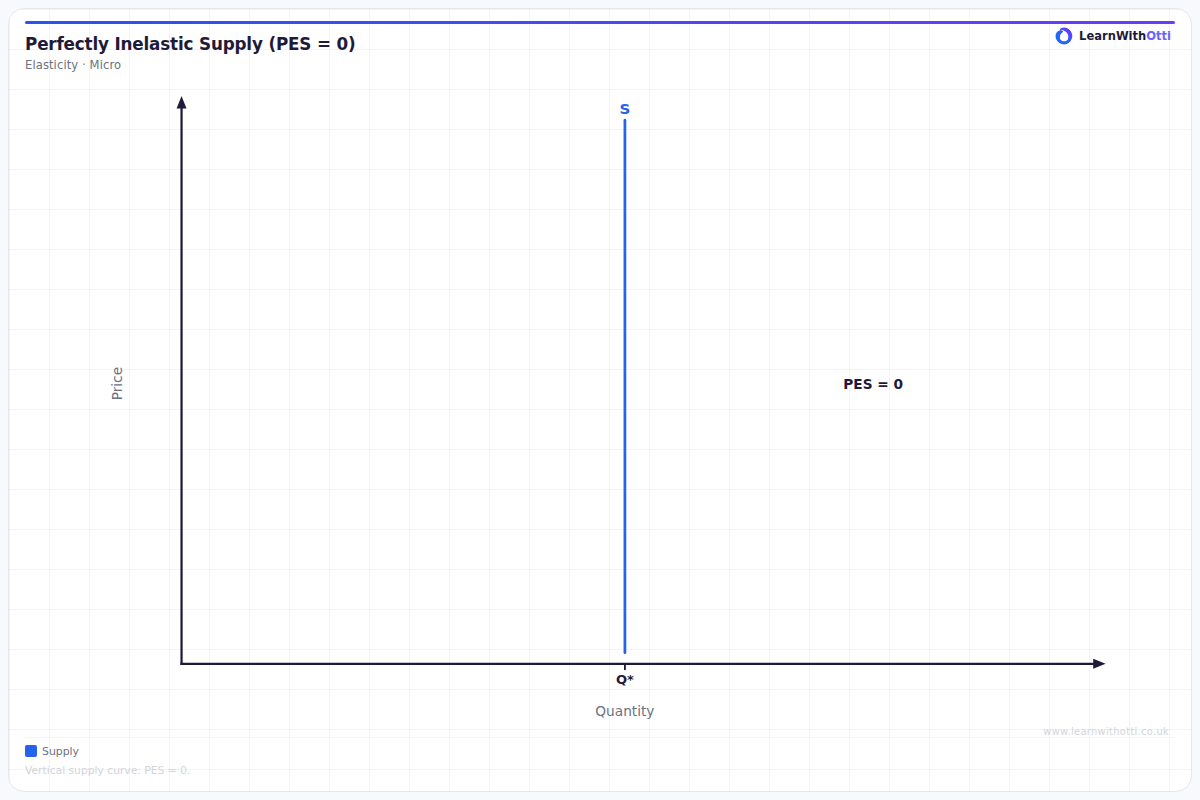
Vertical supply curve showing perfectly inelastic supply (PES = 0). Quantity supplied is fixed regardless of price, as with land or limited-edition goods.
Printable preview
Download a static PNG of this diagram to print or include in revision notes.
Download PNGWhat this diagram shows
A perfectly inelastic supply curve appears as a vertical line, showing that quantity supplied remains completely unchanged regardless of price changes. This occurs when producers cannot adjust their output in response to price fluctuations, typically due to fixed capacity constraints or time limitations. The price elasticity of supply (PES) equals zero because the percentage change in quantity supplied is zero for any percentage change in price. This concept is crucial for understanding market situations where supply-side responses are impossible or extremely limited.
Key points
- The supply curve is perfectly vertical, indicating zero responsiveness of quantity to price changes
- Price Elasticity of Supply (PES) = 0, calculated as % change in quantity supplied ÷ % change in price
- Common examples include fixed seating at venues, land in prime locations, and original artworks by deceased artists
- Producers cannot increase output even when prices rise significantly, often due to physical or time constraints
- Price changes result in no change in quantity supplied, making the supply completely price-inelastic
Exam tip
Students often forget to explain WHY supply is perfectly inelastic - examiners love to see you identify the underlying factors that make quantity supplied completely unresponsive to price changes. Always link the vertical supply curve to real-world examples like concert tickets for a specific venue or land in central London.
Common mistakes
Students frequently confuse perfectly inelastic supply with perfectly elastic supply, drawing horizontal instead of vertical lines. They also often fail to explain that the constraint preventing supply adjustment could be temporary (like concert tickets) or permanent (like beachfront land).
Exam board notes
All major exam boards treat this diagram identically. However, OCR tends to emphasize mathematical calculations of PES more heavily, while AQA focuses more on real-world applications and evaluation of when perfect inelasticity might occur.
Related diagrams
Ask Otti about this diagram
Our AI tutor can walk you through every curve, explain exam technique, and quiz you on it.