Price Elasticity of Supply — Perfectly Elastic
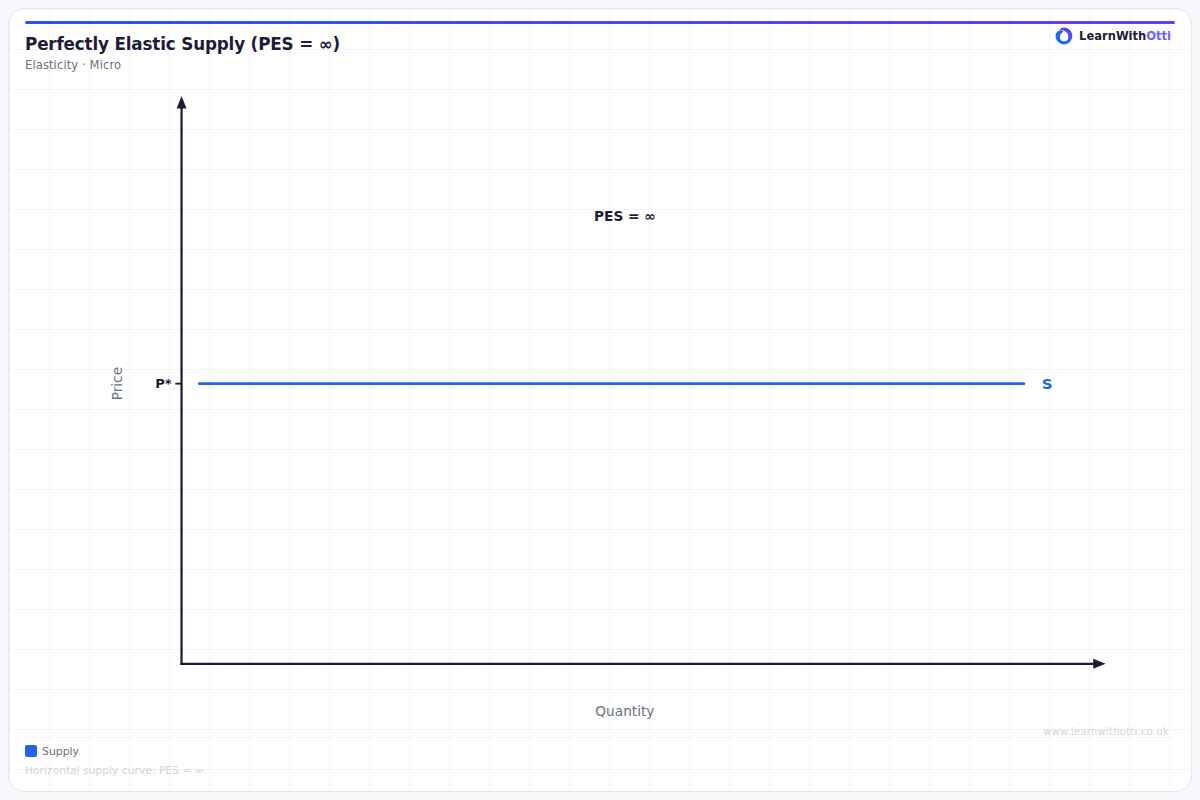
Horizontal supply curve showing perfectly elastic supply (PES = ∞). Producers supply any quantity at a given price but nothing below it.
Printable preview
Download a static PNG of this diagram to print or include in revision notes.
Download PNGWhat this diagram shows
A perfectly elastic supply curve appears as a horizontal line, showing that suppliers are willing to supply any quantity of goods at one specific price level. This means that PES = infinity, as any tiny change in price would result in suppliers either offering unlimited quantities (if price rises) or withdrawing from the market completely (if price falls). This situation typically occurs when firms have significant spare capacity and can easily increase production without increasing costs, or when there are many substitute inputs readily available.
Key points
- The supply curve is perfectly horizontal, indicating PES = infinity
- Suppliers will provide any quantity at the current market price but nothing at a lower price
- Any price increase above the current level would theoretically lead to unlimited supply
- This occurs when firms have excess capacity or when production can be easily scaled up without cost increases
- Real-world examples include digital products, some agricultural products during peak season, or industries with significant unused capacity
Exam tip
Students often confuse perfectly elastic supply with perfectly inelastic supply - remember that perfectly elastic means the curve is HORIZONTAL, not vertical. Examiners are impressed when you explain that this represents a situation where suppliers can produce unlimited quantities at the same price, often due to excess capacity or readily available resources.
Common mistakes
Students frequently draw the curve as vertical instead of horizontal, confusing it with perfectly inelastic supply. They also often fail to explain why the curve would be horizontal, missing the key point about excess capacity or constant marginal costs.
Exam board notes
All major exam boards treat this diagram identically. However, OCR tends to ask more theoretical questions about the mathematical implications of infinite elasticity, while AQA and Edexcel focus more on real-world applications and examples.
Related diagrams
Ask Otti about this diagram
Our AI tutor can walk you through every curve, explain exam technique, and quiz you on it.