Price Elasticity of Supply — Unitary
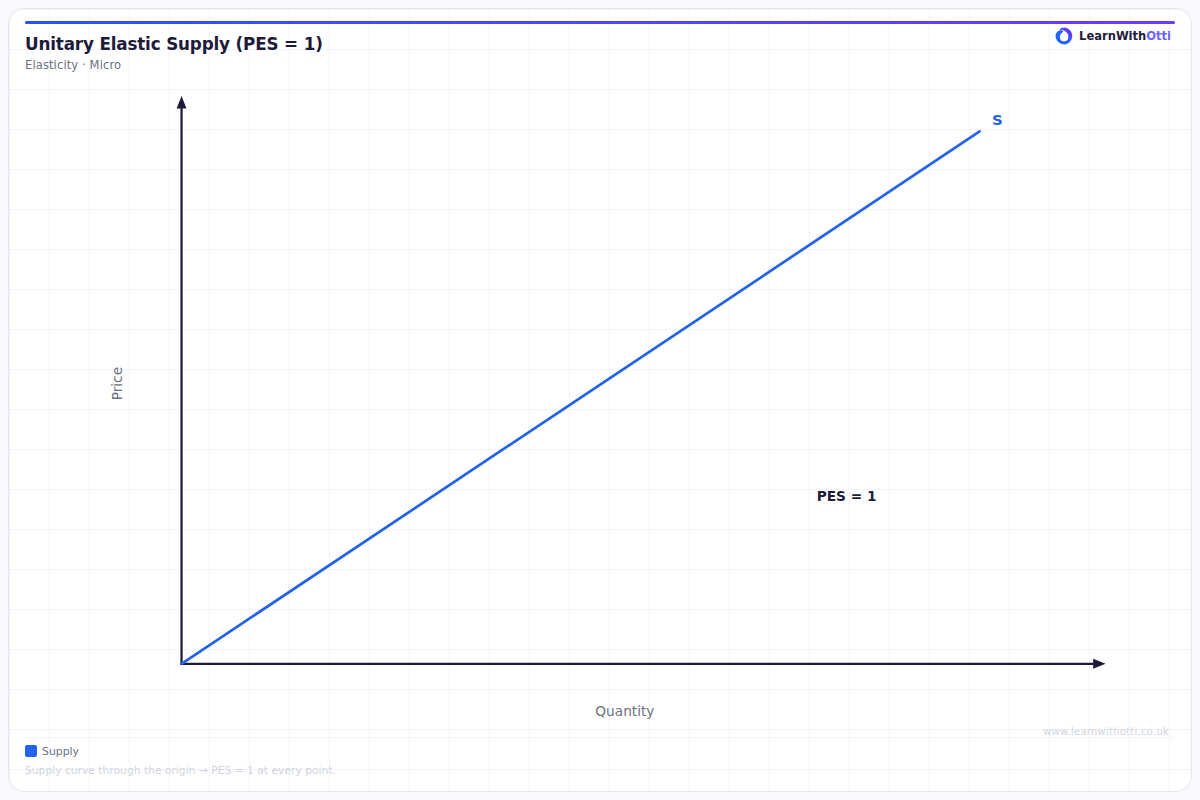
Supply curve with PES = 1, passing through the origin, where the percentage change in quantity supplied exactly matches the percentage change in price.
Printable preview
Download a static PNG of this diagram to print or include in revision notes.
Download PNGWhat this diagram shows
Unitary price elasticity of supply (PES = 1) occurs when the percentage change in quantity supplied exactly equals the percentage change in price. This creates a straight-line supply curve that passes through the origin, showing a proportional relationship between price and quantity. It represents a 'middle ground' between elastic and inelastic supply, where producers respond to price changes in perfect proportion.
Key points
- PES = 1 means percentage change in quantity supplied equals percentage change in price
- The supply curve must be a straight line passing through the origin (0,0)
- Any straight-line supply curve through the origin has unitary elasticity along its entire length
- Represents perfectly proportional response - if price doubles, quantity supplied doubles
- Acts as the boundary between elastic supply (PES > 1) and inelastic supply (PES < 1)
Exam tip
When drawing unitary PES, ensure your supply curve passes through the origin (0,0) - this is the mathematical requirement for PES = 1. Students often draw curves that look right but don't originate from zero, which would actually show variable elasticity.
Common mistakes
Students frequently draw supply curves that look linear but don't pass through the origin, not realizing this creates variable elasticity rather than unitary. Many also confuse this with unit elastic demand curves, which have a different shape entirely.
Exam board notes
All major exam boards treat this diagram identically. The mathematical requirement that unitary PES curves must pass through the origin is consistently emphasized across AQA, Edexcel, OCR and CIE specifications.
Related diagrams
Ask Otti about this diagram
Our AI tutor can walk you through every curve, explain exam technique, and quiz you on it.