Raising a Maximum Price (Price Cap)
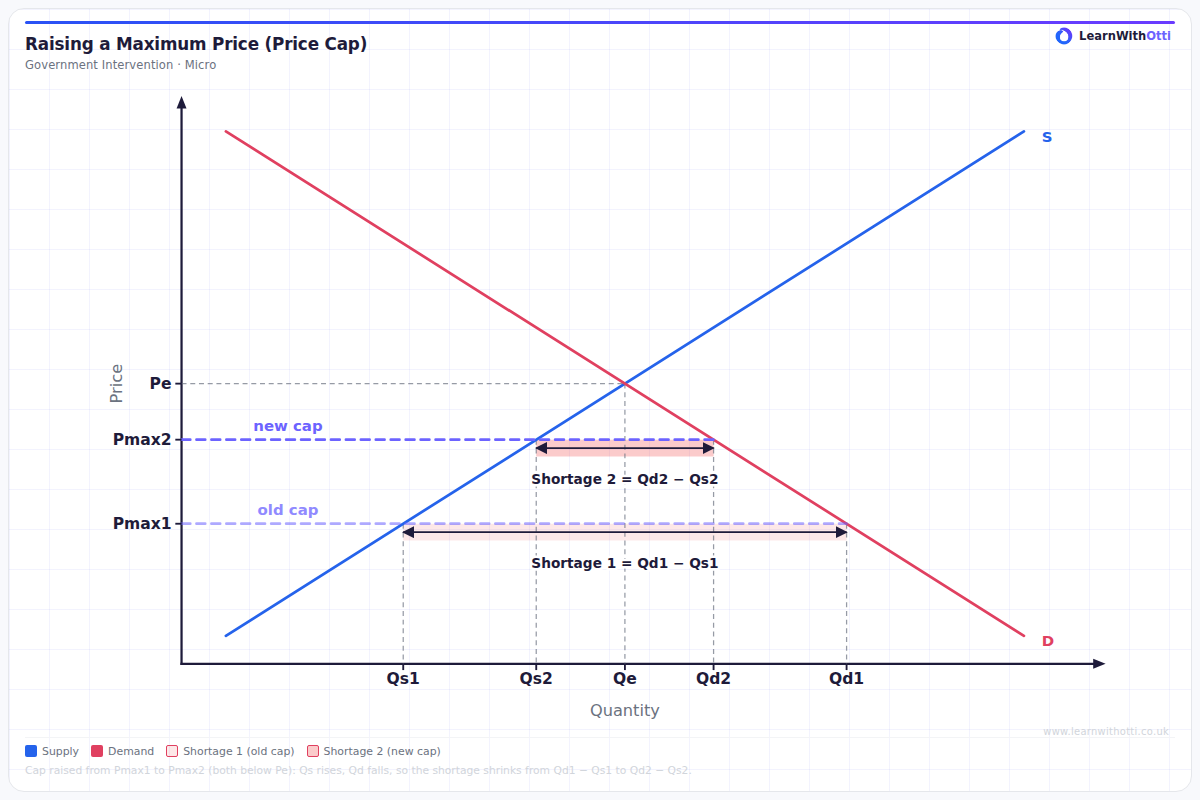
Diagram showing a binding maximum price raised from Pmax1 to Pmax2, closer to equilibrium: quantity supplied rises, quantity demanded falls and the excess demand (shortage) shrinks from Qd1 − Qs1 to Qd2 − Qs2.
Printable preview
Download a static PNG of this diagram to print or include in revision notes.
Download PNGWhat this diagram shows
A maximum price set below the equilibrium price is binding: at the capped price consumers want to buy more than firms are willing to supply, so there is excess demand (a shortage). This diagram shows the cap being raised from Pmax1 to Pmax2, still below equilibrium. At the higher cap, firms supply more (Qs1 rises to Qs2) and consumers demand less (Qd1 falls to Qd2), so the shortage shrinks from Qd1 − Qs1 to Qd2 − Qs2; only if the cap reached the equilibrium price would the shortage disappear. A real example is Ofgem's energy price cap, which is reset every quarter to track suppliers' wholesale and other costs — which is why it rarely causes shortages, and why it went wrong in 2021–22, when wholesale gas prices rose far faster than the cap and around 30 suppliers failed because they could not cover their costs at the capped price.
Key points
- A maximum price only has an effect (is binding) when it is set below the equilibrium price; a cap at or above equilibrium changes nothing
- At any binding cap the shortage is quantity demanded minus quantity supplied at that price, not the vertical gap between the curves
- Raising the cap towards equilibrium increases quantity supplied and reduces quantity demanded — movements along the curves, not shifts — so the shortage gets smaller
- The trade-off: a higher cap protects consumers less on price but reduces rationing, queues, black markets and pressure on firms' finances
- Ofgem's energy price cap is adjusted every quarter to track suppliers' costs so it stays close to a sustainable price; in 2021–22 costs rose faster than the cap and around 30 suppliers failed
Exam tip
Draw the old and the new maximum price both below equilibrium, and mark each shortage as the horizontal gap between quantity demanded and quantity supplied at that price. Then explain the direction of each movement: raising the cap moves the market along the supply curve (quantity supplied rises) and along the demand curve (quantity demanded falls), so the shortage shrinks — the curves themselves do not shift.
Common mistakes
Students often shift the demand or supply curve to show the change, when raising a maximum price is a movement along fixed curves. They also forget that the shortage only disappears when the cap reaches the equilibrium price, or measure the shortage as the vertical distance between the curves instead of Qd − Qs.
Related diagrams
Ask Otti about this diagram
Our AI tutor can walk you through every curve, explain exam technique, and quiz you on it.