Short-Run and Long-Run Average Cost (SRAC and LRAC)
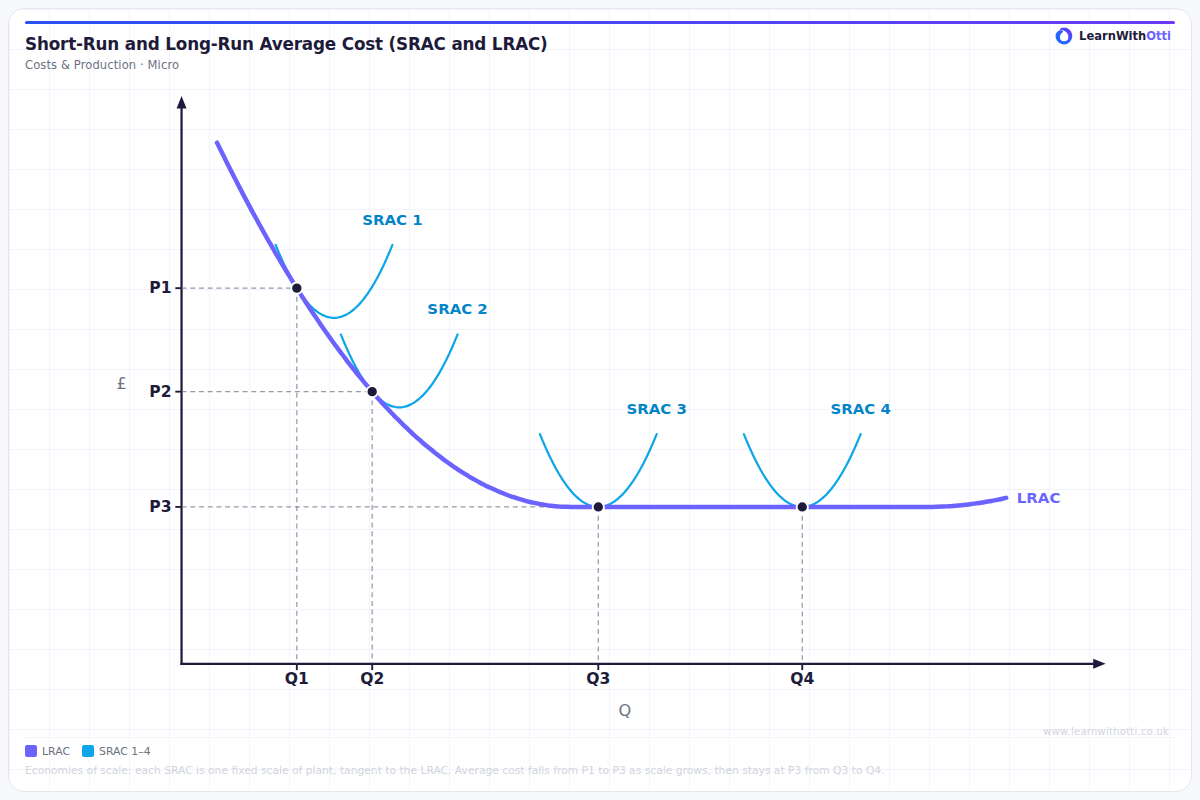
Four short-run average cost curves, each one fixed scale of plant, tangent to a long-run average cost curve that falls (economies of scale) and then flattens (constant returns to scale), with average cost falling from P1 to P3 as scale grows.
Printable preview
Download a static PNG of this diagram to print or include in revision notes.
Download PNGWhat this diagram shows
This diagram shows how a firm's short-run and long-run average costs fit together. Each SRAC curve is a fixed scale of plant: in the short run at least one factor, such as the size of the factory, is fixed, so average cost first falls and then rises as the firm produces more with that plant. The LRAC is the lowest average cost of producing each output when all factors can vary, so the firm can choose the best scale of plant for any output it plans to make. Each SRAC touches the LRAC at one output, Q1 to Q4, and lies above it everywhere else. Moving from SRAC 1 to SRAC 3, the firm builds larger plant and average cost falls from P1 to P3: these are economies of scale. Between Q3 and Q4 the LRAC is flat, so average cost stays at P3 as the firm grows: this is constant returns to scale. At the far right the LRAC turns up only slightly.
Key points
- Each SRAC curve is a fixed scale of plant: at least one factor is fixed in the short run.
- The LRAC is the lowest average cost of each output when all factors can vary, so it lies on or below every SRAC.
- Each SRAC touches the LRAC at a single output (Q1, Q2, Q3, Q4) and lies above it at every other output.
- Moving from SRAC 1 to SRAC 3 lowers average cost from P1 to P3: economies of scale.
- Between Q3 and Q4 average cost stays at P3: constant returns to scale.
- On the falling part of the LRAC, the SRAC touches on its own falling side, so the lowest point of that SRAC is at a higher output than the tangency.
Exam tip
When you draw this diagram, make each SRAC touch the LRAC at exactly one point and never cross below it, and label the touching points with their quantities and average costs. Then use the labels in your explanation: moving from SRAC 1 to SRAC 3 lowers average cost from P1 to P3, and from Q3 to Q4 average cost stays at P3.
Common mistakes
A common mistake is drawing the SRAC curves crossing the LRAC: the LRAC is the lowest possible average cost at each output, so no SRAC can go below it. Another is assuming each SRAC touches the LRAC at the SRAC's own lowest point; that only happens where the LRAC is flat. On the falling section the touching point is on the SRAC's falling side. Students also sometimes treat the LRAC as a short-run curve; it describes the long run, when all factors can vary.
Related diagrams
Ask Otti about this diagram
Our AI tutor can walk you through every curve, explain exam technique, and quiz you on it.