Subsidy Worked Example (Incidence with Numbers)
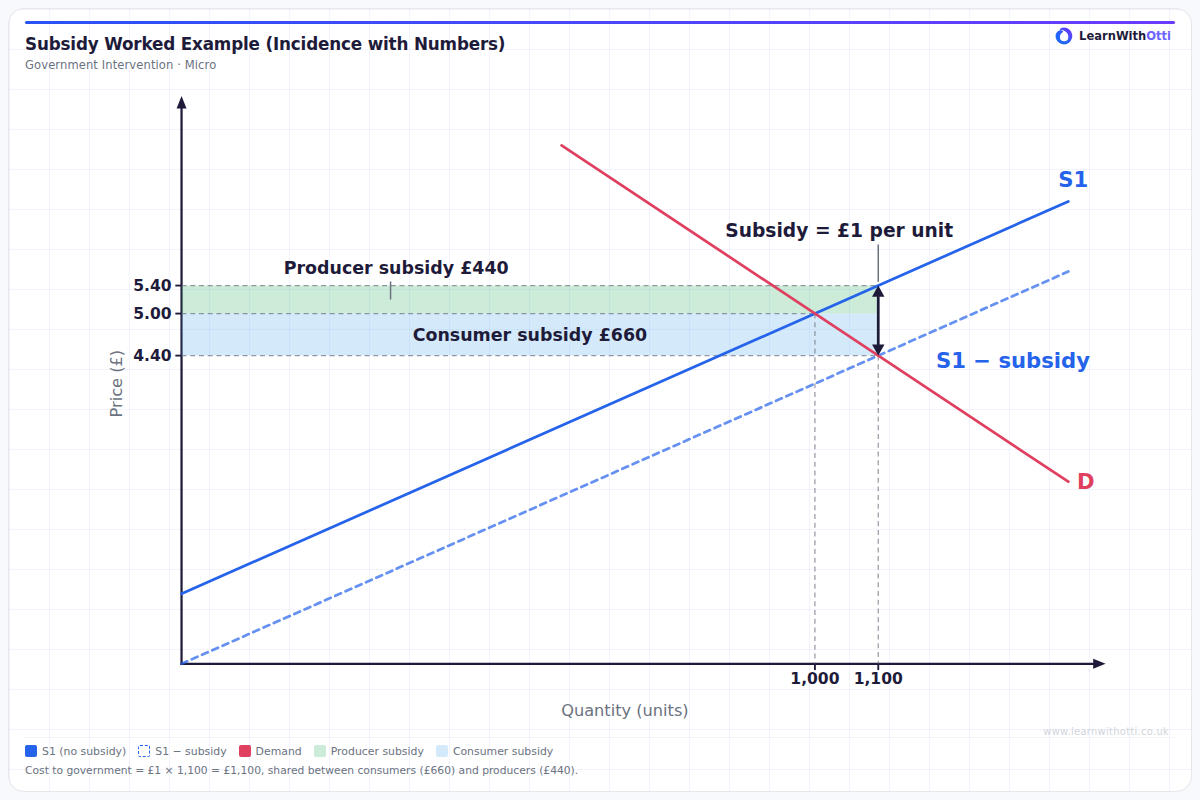
A subsidy of £1 per unit with real numbers: the price consumers pay falls from £5.00 to £4.40 and sales rise from 1,000 to 1,100 units, while producers receive £5.40. Of the £1,100 cost to government, consumers gain £0.60 per unit (£660) and producers £0.40 per unit (£440).
Printable preview
Download a static PNG of this diagram to print or include in revision notes.
Download PNGWhat this diagram shows
This diagram puts numbers on a per-unit subsidy. Before the subsidy, demand (D) and supply (S1) meet at a price of £5.00, where 1,000 units are sold. The government then pays producers a subsidy of £1 for every unit they sell. Because the subsidy is the same amount on every unit, the supply curve shifts down by exactly £1 at every quantity, to S1 − subsidy. The new equilibrium is where D meets S1 − subsidy: consumers now pay £4.40 and 1,100 units are sold. Producers receive the £4.40 from consumers plus £1 from the government, so they get £5.40 per unit, which is the point on the original supply curve at 1,100 units. The £1 subsidy per unit is shared between the two groups. Consumers pay £0.60 less per unit than before (£5.00 − £4.40), so the consumer subsidy is £0.60 × 1,100 = £660, the blue rectangle. Producers receive £0.40 more per unit than before (£5.40 − £5.00), so the producer subsidy is £0.40 × 1,100 = £440, the green rectangle. Together the two rectangles make up the cost to the government: £1 × 1,100 = £1,100. Consumers receive the larger share here because demand is price inelastic between the two prices: a 12% fall in price (from £5.00 to £4.40) raises quantity demanded by 10% (from 1,000 to 1,100), a price elasticity of demand of about −0.83, using percentage changes from the starting values.
Key points
- A subsidy of £1 per unit shifts the supply curve down by exactly £1 at every quantity, from S1 to S1 − subsidy.
- The price consumers pay falls from £5.00 to £4.40, and the quantity sold rises from 1,000 to 1,100 units.
- Producers receive £5.40 per unit: £4.40 from consumers plus £1 from the government.
- The consumer subsidy is £0.60 per unit (£5.00 − £4.40), or £0.60 × 1,100 = £660 in total.
- The producer subsidy is £0.40 per unit (£5.40 − £5.00), or £0.40 × 1,100 = £440 in total.
- The cost to the government is £1 × 1,100 = £1,100, which equals the consumer subsidy plus the producer subsidy (£660 + £440).
- Consumers receive the larger share because demand is price inelastic between £5.00 and £4.40: a 12% price fall raises quantity demanded by 10%, a PED of about −0.83.
Exam tip
When you use this diagram, work through the numbers in order. Start with the subsidy per unit, the vertical distance between S1 and S1 − subsidy (£1). Then find the new price consumers pay (£4.40) and the price producers receive, which is what consumers pay plus the subsidy (£4.40 + £1 = £5.40). Compare each with the original price of £5.00 to get the gain per unit: £0.60 for consumers and £0.40 for producers. Multiply each by the new quantity, 1,100, to get £660 and £440, and check that they add up to the cost to the government of £1 × 1,100 = £1,100.
Common mistakes
A common mistake is to multiply the subsidy per unit by the original quantity (1,000) instead of the quantity sold after the subsidy (1,100). The government pays the subsidy on every unit actually sold, so the cost is £1 × 1,100 = £1,100, not £1,000. Another is to assume the price falls by the full amount of the subsidy: here it falls by only £0.60, because producers keep the other £0.40. A third is to read the price producers receive from the new supply curve; producers receive the price consumers pay plus the subsidy, which is the point on the original supply curve, S1, at the new quantity: £5.40.
Related diagrams
Ask Otti about this diagram
Our AI tutor can walk you through every curve, explain exam technique, and quiz you on it.