Tradable Pollution Permits — Reducing the Cap
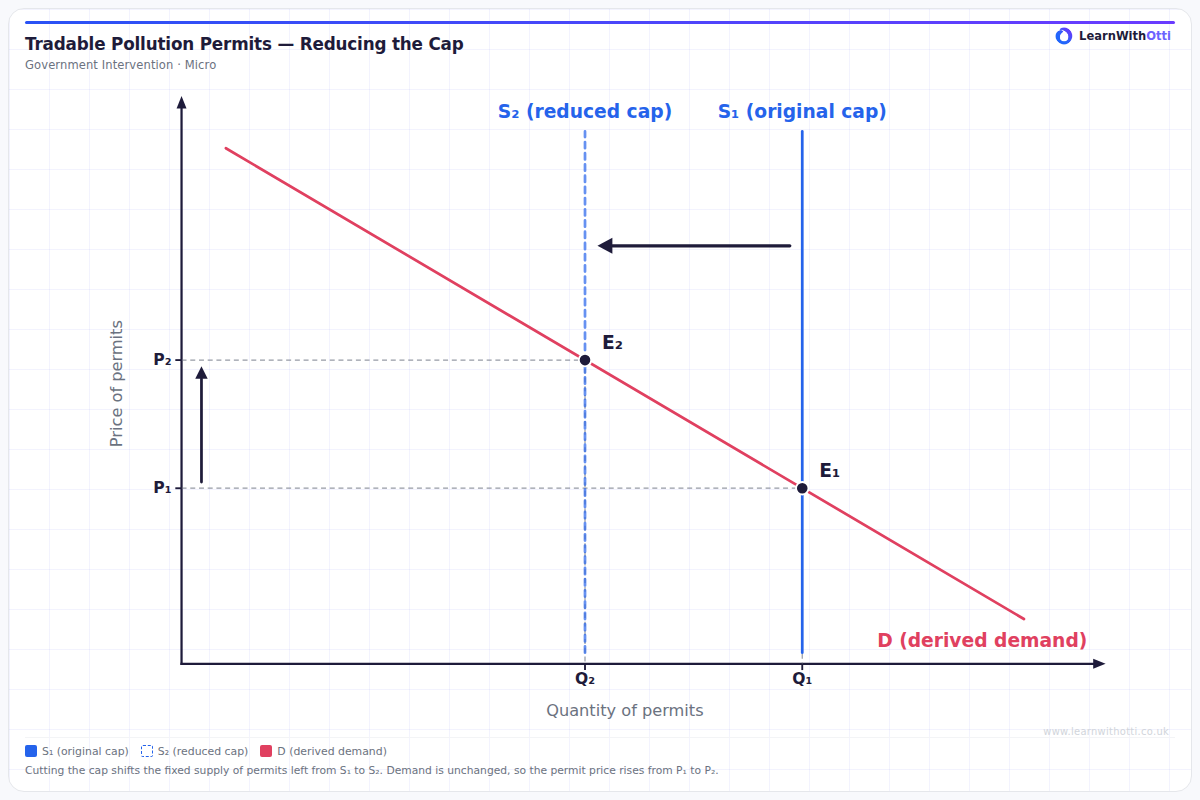
Permit market diagram showing the government cutting the cap: the perfectly inelastic supply of permits shifts left from S1 to S2 while derived demand is unchanged, so the equilibrium permit price rises from P1 to P2 and total emissions fall to the new cap.
Printable preview
Download a static PNG of this diagram to print or include in revision notes.
Download PNGWhat this diagram shows
This diagram shows what happens in a permit market when the government reduces the cap. The supply of permits is set by the government, so it is a vertical line at the number of permits issued: S1 at the original cap, Q1. Demand for permits is a derived demand: firms want permits because they need them to keep producing and emitting, and how much they will pay for one reflects their marginal cost of abating (cutting) emissions instead. When the government cuts the cap from Q1 to Q2, the vertical supply line shifts left from S1 to S2. Demand has not changed, so permits are now scarcer and the equilibrium price rises from P1 to P2. The market sets this new price, given the new cap. A higher permit price raises the marginal cost of emitting, so cutting emissions becomes the cheaper option for more firms: they abate rather than buy permits, and total emissions fall to the new cap. In evaluation, the price rise may not last: over time, firms' investment in abatement reduces their demand for permits, so D shifts left and the price can fall back from P2. A cut that is too large also risks firms relocating to countries without a cap, so that emissions move abroad rather than falling (carbon leakage).
Key points
- The supply of permits is fixed by the government at the cap, so it is perfectly inelastic: a vertical line.
- Reducing the cap shifts the supply of permits to the left, from S1 to S2; it is not a movement along a supply curve.
- Demand for permits is a derived demand that reflects firms' marginal abatement costs, and it does not change when the cap is cut.
- The higher permit price strengthens the incentive for firms to invest in cleaner technology, which improves dynamic efficiency.
- Higher permit costs raise firms' costs of production, and these may be passed on to consumers as higher prices.
Exam tip
Draw the supply of permits as a VERTICAL line. The government fixes the number of permits regardless of their price, so supply is perfectly inelastic. A sloping supply curve for permits is the most common error, and it implies the government responds to price by issuing more permits when the price rises, which it does not. Show the cut in the cap as the vertical line moving left, from S1 to S2, with the demand curve left exactly where it was.
Common mistakes
The most common mistake is drawing a sloping supply curve for permits; the cap is fixed by the government, so supply must be vertical. Another is shifting the demand curve instead of supply: cutting the cap changes the number of permits available, not firms' demand for them. A third is saying the government sets the new price. The government sets only the quantity of permits; the market sets the price, given the new cap.
Related diagrams
Ask Otti about this diagram
Our AI tutor can walk you through every curve, explain exam technique, and quiz you on it.