Tradable Pollution Permits (Cap and Trade)
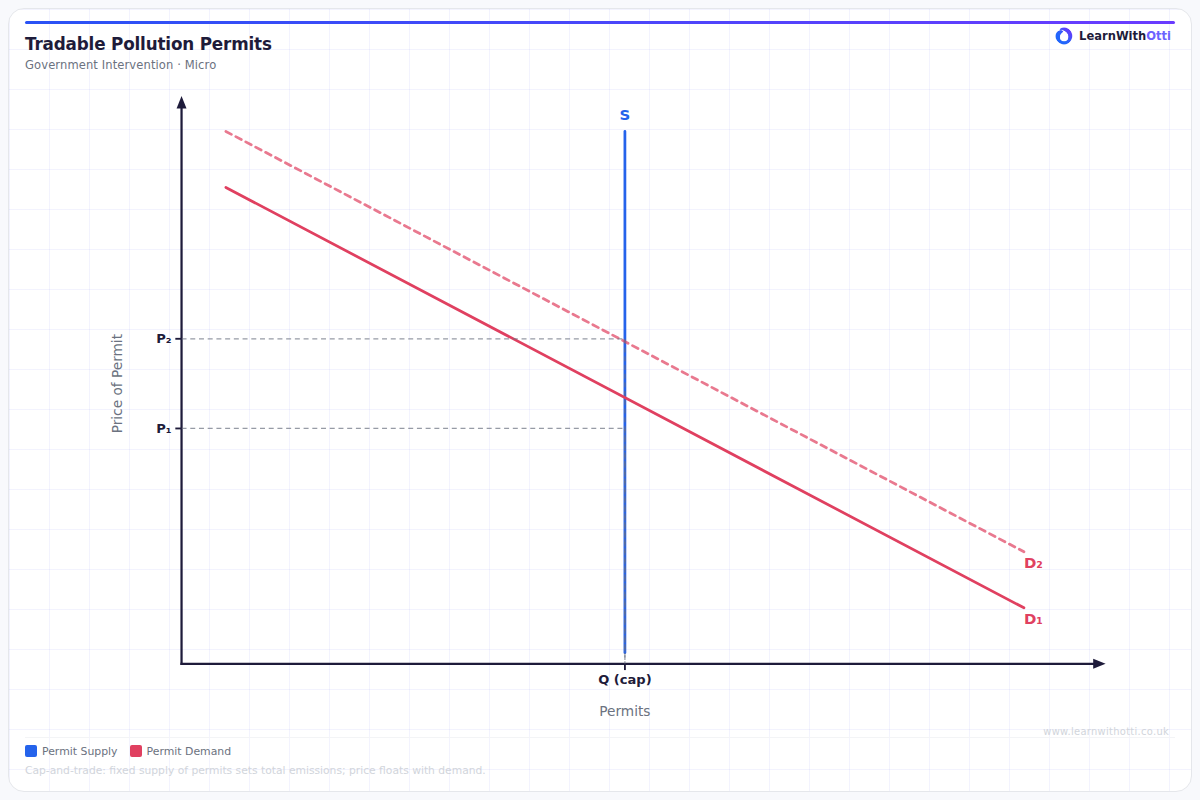
Diagram illustrating a cap-and-trade scheme for pollution, showing how the permit market sets a price for emissions and achieves a socially optimal output level.
Printable preview
Download a static PNG of this diagram to print or include in revision notes.
Download PNGWhat this diagram shows
This diagram shows how tradable pollution permits create a market-based solution to negative externalities like pollution. The government sets a total pollution limit (the 'cap') and issues permits equal to this amount, then firms can buy and sell these permits amongst themselves (the 'trade'). This system harnesses market forces to reduce pollution at the lowest possible cost to society, as firms with high cleanup costs will buy permits while firms with low cleanup costs will sell their permits and reduce emissions instead.
Key points
- The government sets a cap (total limit) on pollution and issues permits equal to this amount
- Firms can trade permits freely - those finding it expensive to reduce pollution buy permits, while those finding it cheap to clean up sell permits
- The permit price is determined by supply and demand, creating a market incentive to reduce pollution
- Total pollution stays within the cap regardless of which individual firms pollute, ensuring environmental targets are met
- The system achieves pollution reduction at minimum cost because it allows the market to direct cuts to where they're cheapest to implement
Exam tip
Students often confuse cap and trade with carbon taxes - remember that permits create a QUANTITY ceiling (the cap) while letting the PRICE be determined by market forces. Examiners are impressed when you explain how the system automatically directs pollution cuts to the most cost-effective firms, as expensive-to-clean firms buy permits from cheap-to-clean firms.
Common mistakes
Students often think the government sets the permit price, when actually the price is determined by trading between firms in the permit market. Another common error is confusing this with a tax - permits limit quantity and let price vary, while taxes set price and let quantity vary.
Exam board notes
All major exam boards treat this diagram identically, though OCR tends to emphasize the practical challenges of monitoring and enforcement more than other boards. AQA and Edexcel often link this to real-world examples like the EU Emissions Trading System.
Related diagrams
Ask Otti about this diagram
Our AI tutor can walk you through every curve, explain exam technique, and quiz you on it.