Alternative Business Objectives (Profit, Revenue and Sales Maximisation)
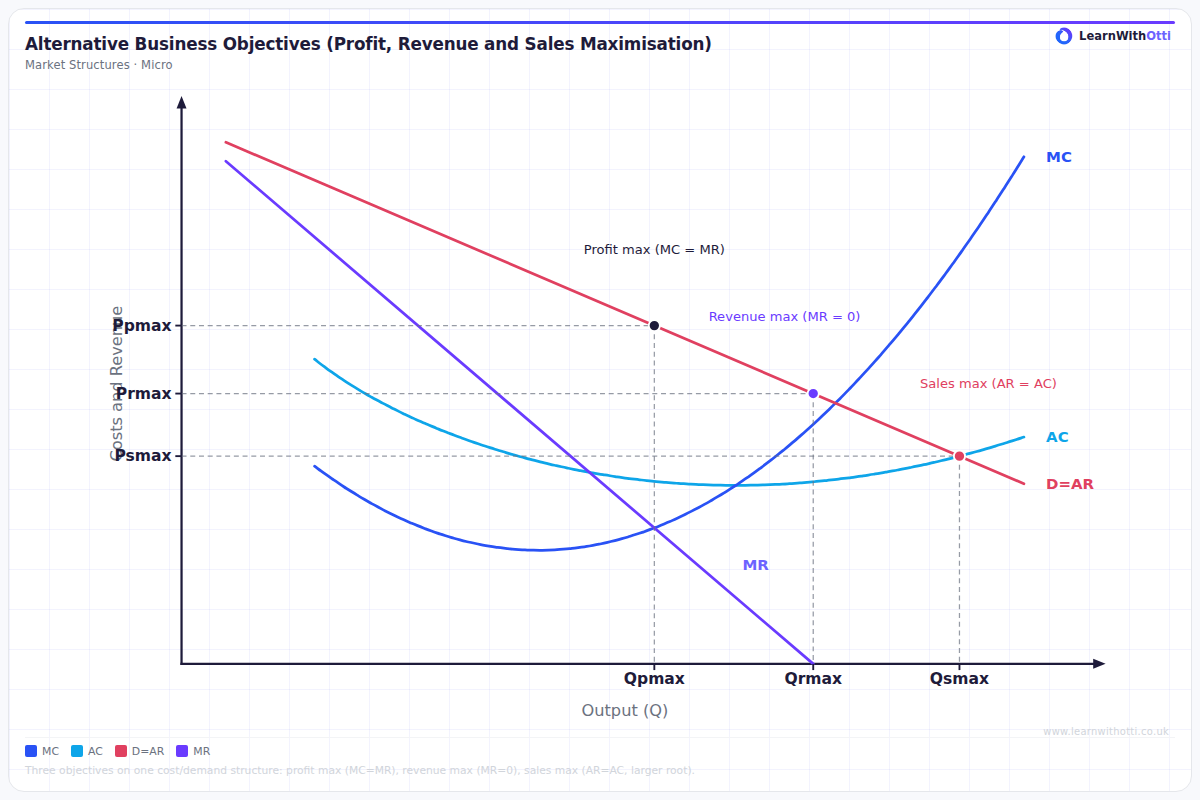
Diagram comparing profit maximisation (MC = MR) with the alternative objectives of revenue maximisation (MR = 0) and sales maximisation (AR = AC), as explored in Baumol and satisficing theories of the firm.
Printable preview
Download a static PNG of this diagram to print or include in revision notes.
Download PNGWhat this diagram shows
This diagram plots a firm's cost and revenue curves (AR, MR, AC, MC) on a single graph to show that different business objectives lead to different output and price decisions. Rather than always assuming firms profit maximise (MC=MR), the diagram reveals that managers, shareholders, and owners can have conflicting goals — a key insight for understanding real-world firm behaviour. For A-Level, this is crucial because it challenges the traditional profit-maximising assumption and links directly to the principal-agent problem and managerial theories of the firm. Understanding where each objective sits on the diagram helps you evaluate firm behaviour across all market structures.
Key points
- Profit maximisation occurs where MC = MR — this gives the lowest output and typically the highest price of the three objectives shown.
- Revenue maximisation occurs where MR = 0 — the firm produces more output and charges a lower price than under profit maximisation, as total revenue is at its peak when the last unit adds nothing to revenue.
- Sales maximisation (volume) occurs where AR = AC (normal profit / break-even point) — the firm pushes output even further, pricing as low as possible without making a loss, which could help deter entry or grow market share.
- The principal-agent problem explains why objectives diverge: managers (agents) may pursue revenue or sales maximisation to increase their own salaries or prestige, while shareholders (principals) prefer profit maximisation.
- Each objective produces a different price-output combination, so identifying which objective a firm is pursuing helps predict its behaviour — especially relevant when evaluating monopoly power or comparing market structures.
Exam tip
The most impressive thing you can do in an exam is clearly distinguish between the THREE output levels on the same diagram — profit maximisation (MC=MR), revenue maximisation (MR=0), and sales maximisation (AR=AC, breaking even) — and explain why a firm might rationally choose each. Examiners award high marks for linking each objective to a real-world context, such as a manager pursuing sales maximisation to boost their own bonus or a new entrant using revenue maximisation to gain market share.
Common mistakes
Students frequently confuse revenue maximisation with profit maximisation, mistakenly stating that maximising revenue is the same as maximising profit — in fact, revenue maximisation ignores costs entirely and always leads to greater output and lower price than profit maximisation. Another common error is placing sales maximisation at any output beyond break-even, when it should be precisely at the point where AR = AC (normal profit), not where the firm makes a loss.
Exam board notes
AQA and Edexcel both require knowledge of all three objectives shown here and expect students to link them to the principal-agent problem between owners and managers. Edexcel places particular emphasis on evaluating why a firm might rationally depart from profit maximisation, while AQA more often asks students to identify the output and price implications of each objective directly from the diagram.
Related diagrams
Ask Otti about this diagram
Our AI tutor can walk you through every curve, explain exam technique, and quiz you on it.