Contractionary Fiscal Policy
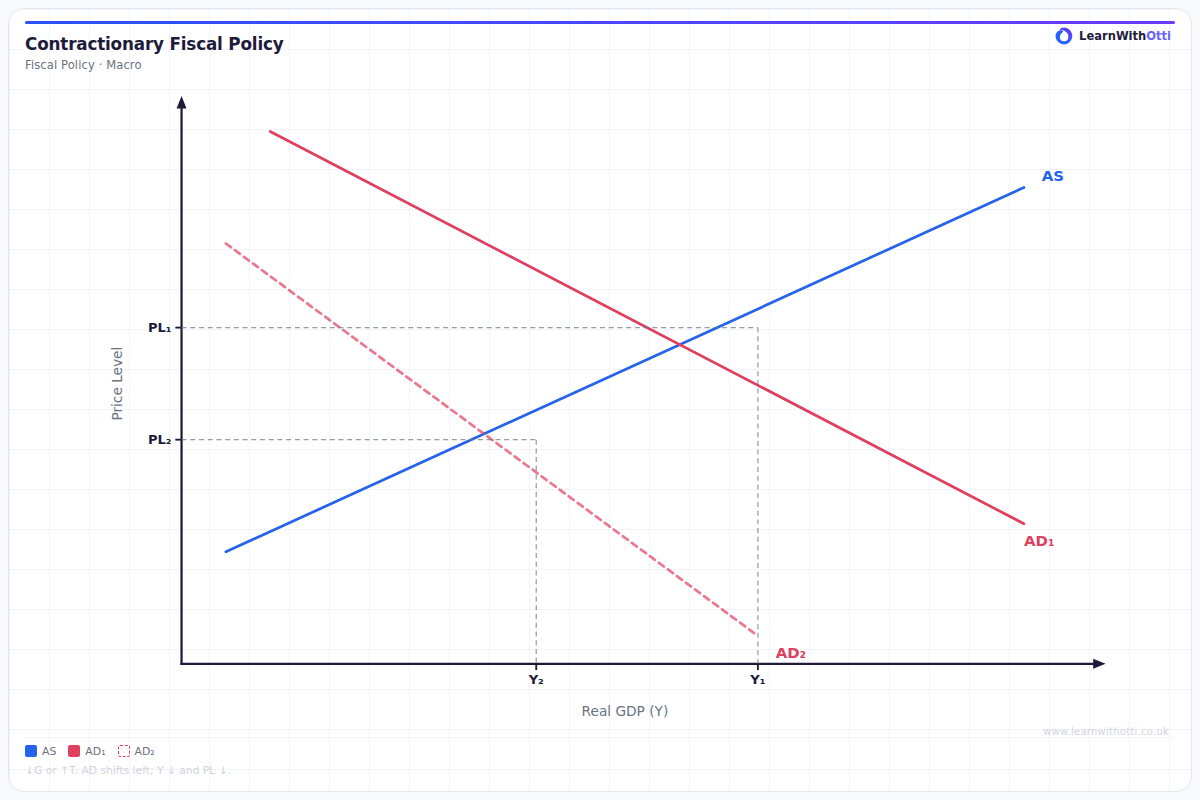
AD/AS diagram showing the effect of a cut in government spending or a tax rise, shifting AD left to reduce inflationary pressure at the cost of lower real output.
Printable preview
Download a static PNG of this diagram to print or include in revision notes.
Download PNGWhat this diagram shows
This diagram illustrates how contractionary fiscal policy shifts the aggregate demand curve leftward, leading to lower price levels and reduced real GDP. Contractionary fiscal policy involves either increasing taxes, reducing government spending, or both, which decreases aggregate demand in the economy. The diagram shows the economy moving from an initial equilibrium to a new equilibrium with lower output and price levels. This policy is typically used to combat inflation or reduce budget deficits when the economy is overheating.
Key points
- Contractionary fiscal policy shifts AD curve leftward (AD1 to AD2) through higher taxes and/or reduced government spending
- New equilibrium shows lower real GDP (Y1 to Y2) and lower price level (P1 to P2), helping to reduce inflationary pressure
- The multiplier effect amplifies the initial policy change, meaning the total fall in AD exceeds the initial fiscal contraction
- Policy is most effective when the economy is operating above full employment and experiencing demand-pull inflation
- Timing is crucial - contractionary policy during a recession could worsen unemployment and economic downturn
Exam tip
Always clearly label the leftward shift of AD and explain the transmission mechanism - don't just state that contractionary fiscal policy reduces AD without explaining how tax increases reduce disposable income or how spending cuts directly reduce government expenditure. Examiners are impressed when students link the diagram to real-world policy examples and discuss the multiplier effect working in reverse.
Common mistakes
Students often confuse the direction of the shift, mistakenly shifting AD rightward when describing contractionary policy. They also frequently forget to explain that the multiplier effect means the total change in AD is greater than the initial policy change.
Exam board notes
All major exam boards treat this diagram identically, focusing on the leftward AD shift and its effects on price level and real GDP. Some boards may emphasize different policy tools or give varying weight to discussing automatic stabilizers versus discretionary policy.
Related diagrams
Ask Otti about this diagram
Our AI tutor can walk you through every curve, explain exam technique, and quiz you on it.