Crowding Out
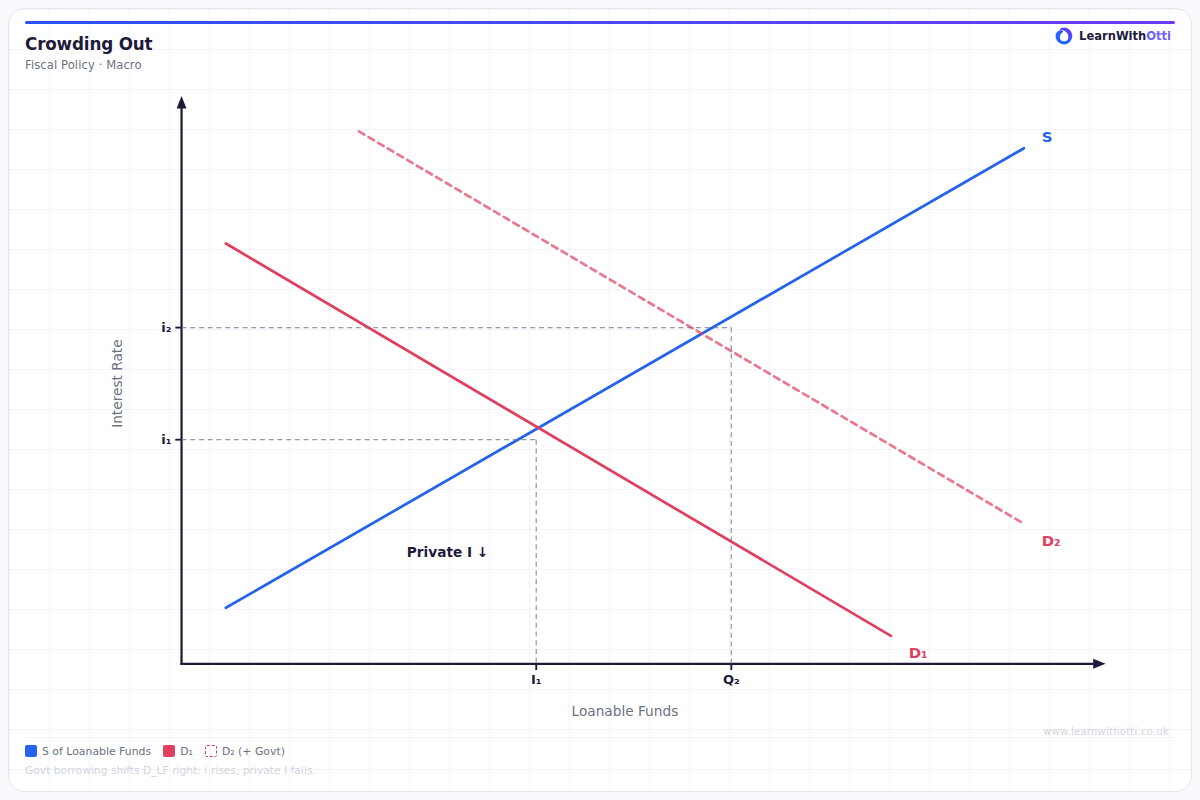
Diagram showing how increased government borrowing raises interest rates, reducing private investment and partially offsetting the fiscal stimulus (crowding out effect).
Printable preview
Download a static PNG of this diagram to print or include in revision notes.
Download PNGWhat this diagram shows
The crowding out diagram illustrates how expansionary fiscal policy can reduce private sector investment, potentially offsetting some of the intended stimulus effects. When government increases spending or cuts taxes, it typically needs to borrow more money, increasing demand for loanable funds. This drives up interest rates, making borrowing more expensive for businesses and consumers, which can reduce private investment and consumption. Understanding this concept is crucial for evaluating the effectiveness of fiscal policy as a demand management tool.
Key points
- Crowding out occurs when government borrowing increases interest rates, reducing private sector spending
- The loanable funds market shows how increased government demand for funds shifts demand right, raising interest rates
- Higher interest rates discourage private investment and interest-sensitive consumption (e.g., mortgages, car loans)
- The extent of crowding out depends on factors like spare capacity in the economy, monetary policy response, and how government spending is financed
- Complete crowding out makes fiscal policy ineffective, while partial crowding out reduces but doesn't eliminate the fiscal multiplier effect
Exam tip
Examiners are impressed when students clearly explain the transmission mechanism - how increased government borrowing leads to higher interest rates, which then reduces private investment. Many students incorrectly assume crowding out is automatic and immediate, but you should emphasize it depends on economic conditions like spare capacity and monetary policy response.
Common mistakes
Students often assume crowding out always happens to the same extent, ignoring that it's much less likely during recessions when there's spare capacity and low private investment demand. They also forget that if the central bank accommodates fiscal policy by keeping interest rates low, crowding out can be prevented.
Exam board notes
All major exam boards treat this diagram identically, focusing on the loanable funds market mechanism. However, Edexcel tends to place slightly more emphasis on numerical examples showing different degrees of crowding out in their mark schemes.
Related diagrams
Ask Otti about this diagram
Our AI tutor can walk you through every curve, explain exam technique, and quiz you on it.