Monetary Policy Transmission Mechanism
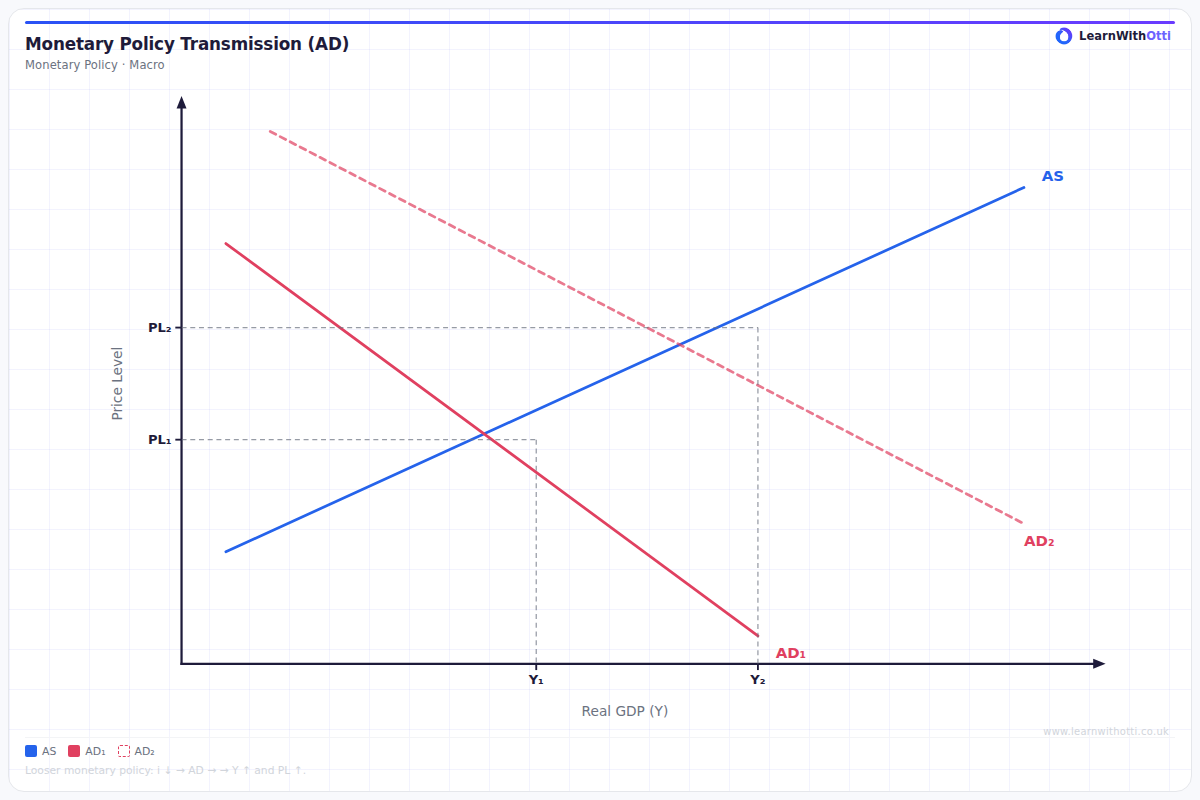
Flow diagram showing how a change in the central bank base rate transmits through the economy: affecting market rates, asset prices, exchange rates, and ultimately output and inflation.
Printable preview
Download a static PNG of this diagram to print or include in revision notes.
Download PNGWhat this diagram shows
The Monetary Policy Transmission Mechanism shows the step-by-step process of how central bank policy decisions (like changing interest rates) eventually affect the real economy. It demonstrates the chain of cause and effect from the initial policy change through financial markets, then to households and businesses, and finally to overall economic indicators like GDP and inflation. This diagram is crucial for understanding why monetary policy changes don't have immediate effects and why there are significant time lags. It helps explain the complexity of managing an economy through monetary policy tools.
Key points
- The mechanism starts with central bank policy decisions (interest rates, quantitative easing) and moves through multiple stages
- Financial markets respond first - bond prices, exchange rates, and bank lending rates adjust relatively quickly
- Household and business behaviour changes more slowly - affecting consumption, investment, and saving decisions
- Real economy variables (GDP, employment, inflation) are affected last, often with lags of 12-24 months
- Each link in the chain can be stronger or weaker depending on economic conditions - the mechanism can break down during crises
Exam tip
Examiners are impressed when students can explain the time lags at each stage of the transmission mechanism - for example, how it takes months for interest rate changes to fully impact consumer spending and investment. The most common error is treating the transmission as instant and inevitable, when in reality each link can be weak or broken.
Common mistakes
Students often assume the transmission mechanism works perfectly and predictably, failing to explain that links can be weak or broken (especially during recessions or financial crises). They also frequently ignore the significant time lags involved, suggesting that monetary policy has immediate effects on inflation and growth.
Exam board notes
All major exam boards treat this diagram identically, though OCR tends to place slightly more emphasis on the role of expectations in the transmission process. AQA and Edexcel commonly ask students to evaluate the effectiveness of different stages in the mechanism.
Related diagrams
Ask Otti about this diagram
Our AI tutor can walk you through every curve, explain exam technique, and quiz you on it.