Liquidity Trap
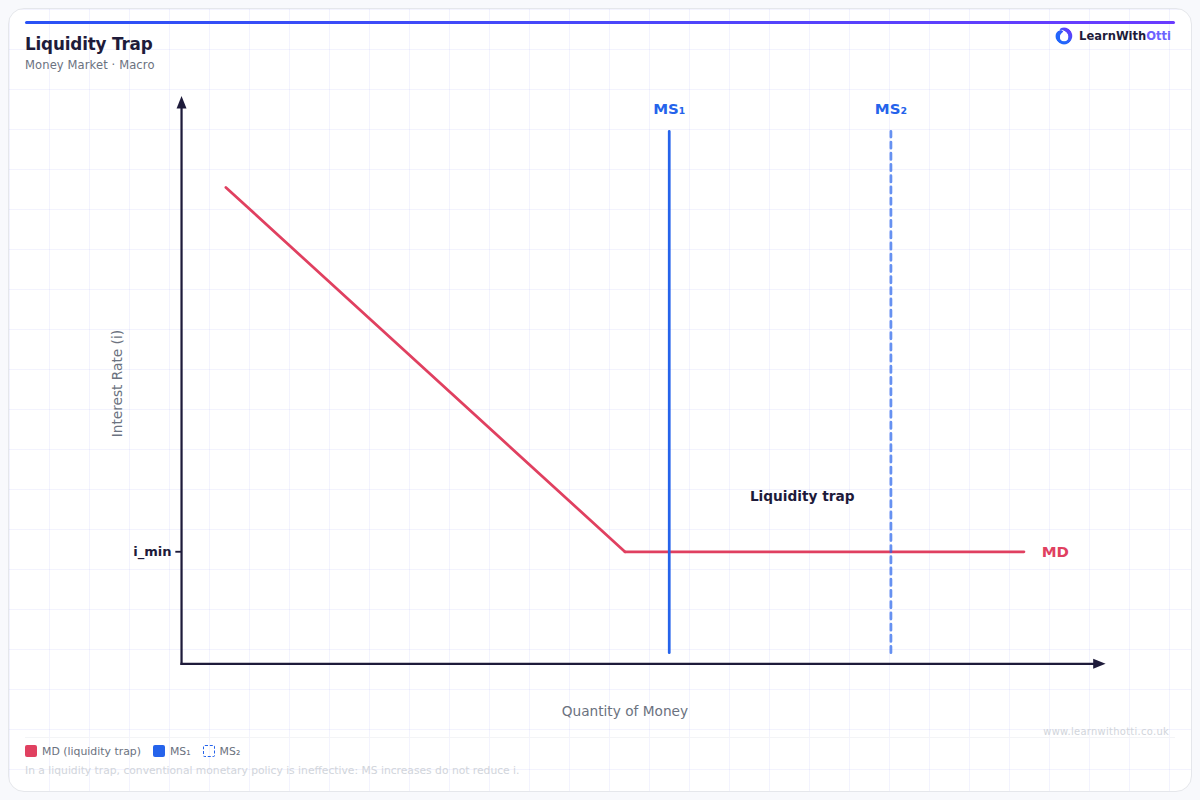
Money market diagram showing the liquidity trap: when interest rates approach zero, increases in money supply fail to lower rates further, making conventional monetary policy ineffective.
Printable preview
Download a static PNG of this diagram to print or include in revision notes.
Download PNGWhat this diagram shows
The liquidity trap diagram shows a situation where monetary policy becomes ineffective because the demand for money becomes perfectly elastic (horizontal) at very low interest rates. When interest rates are near zero, people hold money rather than bonds because they expect rates to rise in future, which would reduce bond prices. This means central banks cannot stimulate the economy further by cutting interest rates, as additional money supply increases have no effect on interest rates or investment.
Key points
- At very low interest rates, the money demand curve becomes perfectly elastic (horizontal)
- Increases in money supply (rightward shifts) do not lower interest rates further
- People prefer holding cash over bonds when rates are near zero due to expectations of future rate rises
- Monetary policy becomes ineffective as a tool for economic stimulation
- Associated with deflationary periods and economic stagnation (e.g., Japan 1990s, post-2008 crisis)
Exam tip
Students often forget to explain WHY the demand for money becomes perfectly elastic in a liquidity trap - it's because people expect interest rates to rise in future, making bonds less attractive. Examiners are impressed when you link this to real-world examples like Japan in the 1990s or the UK/US after 2008.
Common mistakes
Students often incorrectly show the liquidity trap occurring at high interest rates rather than very low rates. They also forget to explain that it's expectations about future interest rate movements that drive the perfectly elastic demand for money.
Exam board notes
All major exam boards treat this diagram identically, though Edexcel tends to emphasise the policy implications more heavily while AQA focuses slightly more on the theoretical mechanics of why the trap occurs.
Related diagrams
Ask Otti about this diagram
Our AI tutor can walk you through every curve, explain exam technique, and quiz you on it.