Increase in Money Supply
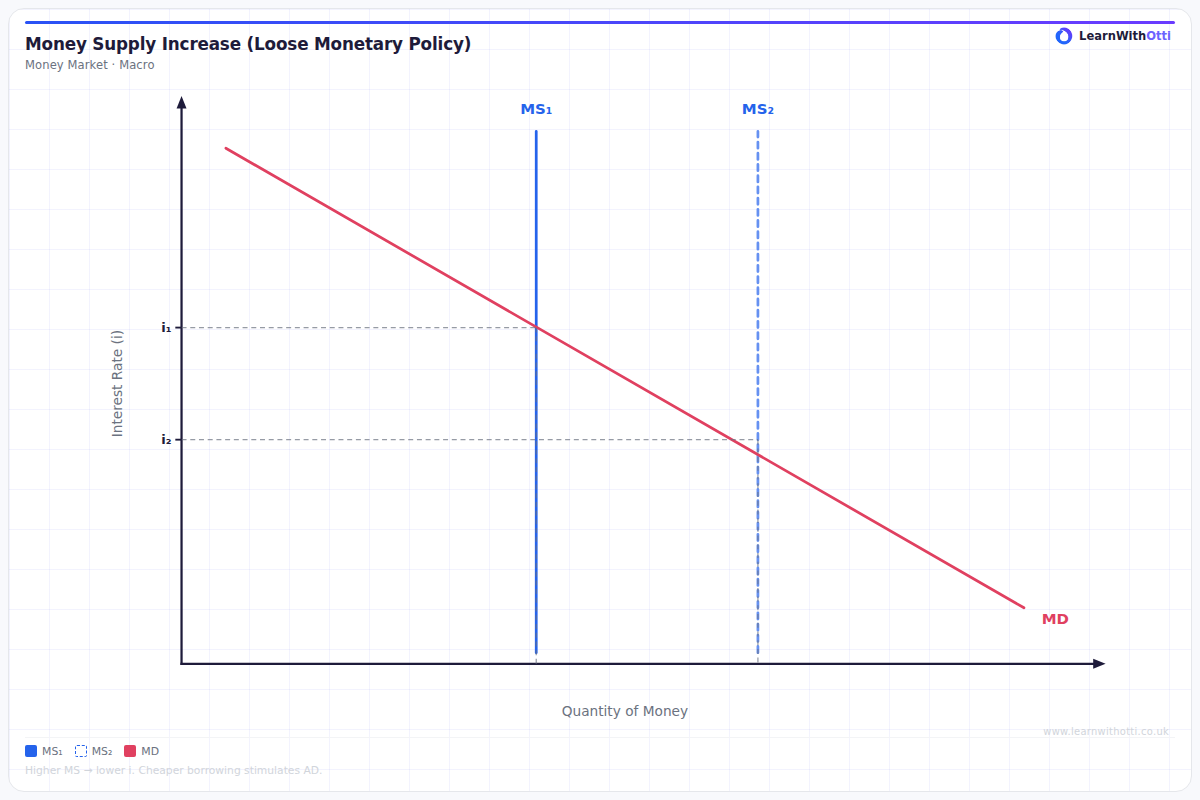
Money market diagram showing a rightward shift in money supply, reducing the interest rate and stimulating borrowing and investment.
Printable preview
Download a static PNG of this diagram to print or include in revision notes.
Download PNGWhat this diagram shows
This diagram illustrates how an increase in the money supply shifts the money supply curve rightward, leading to a fall in interest rates from i1 to i2. When the central bank increases money supply through quantitative easing or lowering reserve requirements, more money becomes available in the economy. The lower interest rates make borrowing cheaper for firms and consumers, encouraging investment and spending, which can stimulate economic growth and potentially lead to inflation.
Key points
- Rightward shift of money supply curve (MS1 to MS2) represents expansionary monetary policy
- Equilibrium interest rate falls from i1 to i2 as money becomes more abundant
- Lower interest rates reduce the cost of borrowing, encouraging investment and consumption
- Increased spending can lead to higher aggregate demand, economic growth, and potential inflation
- The money demand curve remains unchanged - only the supply of money increases
Exam tip
Examiners are impressed when students clearly explain the transmission mechanism - how an increase in money supply leads to lower interest rates, then increased investment and consumption. Many students jump straight to the final outcome without explaining the logical chain of cause and effect that connects monetary expansion to economic growth.
Common mistakes
Students often confuse this with fiscal policy or fail to explain why interest rates fall when money supply increases. They frequently forget that it's the abundance of money (increased supply) that drives down its 'price' (the interest rate).
Exam board notes
All major exam boards treat this diagram identically, though OCR tends to place slightly more emphasis on the mathematical relationship between money supply changes and interest rate movements. AQA and Edexcel often link this diagram more explicitly to AD/AS analysis in their mark schemes.
Related diagrams
Ask Otti about this diagram
Our AI tutor can walk you through every curve, explain exam technique, and quiz you on it.