Quantitative Easing (QE)
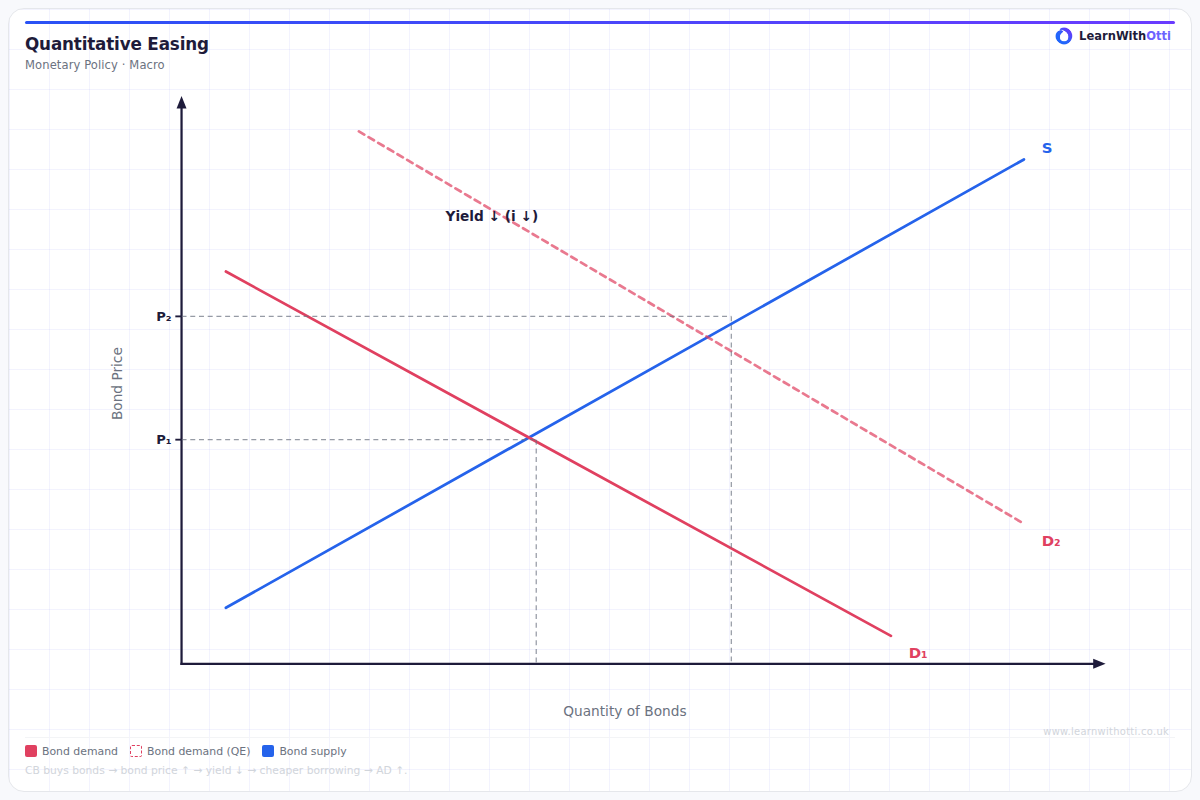
Diagram explaining quantitative easing: the central bank purchases government bonds, increasing the money supply, pushing down long-term interest rates, and boosting asset prices.
Printable preview
Download a static PNG of this diagram to print or include in revision notes.
Download PNGWhat this diagram shows
This diagram illustrates Quantitative Easing (QE), an unconventional monetary policy tool used when traditional interest rate cuts are no longer effective (typically at the zero lower bound). The central bank creates new money electronically and uses it to purchase government bonds and other securities from commercial banks and financial institutions. This process increases the money supply, lowers long-term interest rates, and encourages banks to lend more, ultimately stimulating economic activity when conventional monetary policy has reached its limits.
Key points
- QE is used when conventional monetary policy (lowering base rates) becomes ineffective, typically at or near the zero lower bound
- The central bank creates new money electronically (not physically printing) to purchase government bonds and other securities from banks
- Bond purchases increase bond prices and lower yields, reducing long-term interest rates across the economy
- Banks receive cash in exchange for bonds, increasing their reserves and encouraging them to increase lending to businesses and consumers
- The ultimate goal is to increase aggregate demand through higher investment and consumption when traditional rate cuts cannot work
Exam tip
Students often confuse QE with conventional monetary policy - make sure you emphasize that QE involves creating new money electronically to buy bonds when interest rates are already near zero. Examiners are impressed when you explain the transmission mechanism clearly, showing how bond purchases increase money supply and lower long-term interest rates.
Common mistakes
Students frequently think QE involves physically printing money and handing it directly to consumers or businesses. In reality, QE works indirectly through the banking system - the central bank buys bonds from banks, giving them cash reserves which should encourage more lending.
Exam board notes
All major exam boards treat this diagram identically, focusing on QE as an unconventional monetary policy tool used at the zero lower bound. However, AQA tends to emphasize the evaluation of QE's effectiveness more heavily, while OCR often links it more explicitly to liquidity trap scenarios.
Related diagrams
Ask Otti about this diagram
Our AI tutor can walk you through every curve, explain exam technique, and quiz you on it.