Fisher's Equation of Exchange (MV = PQ)
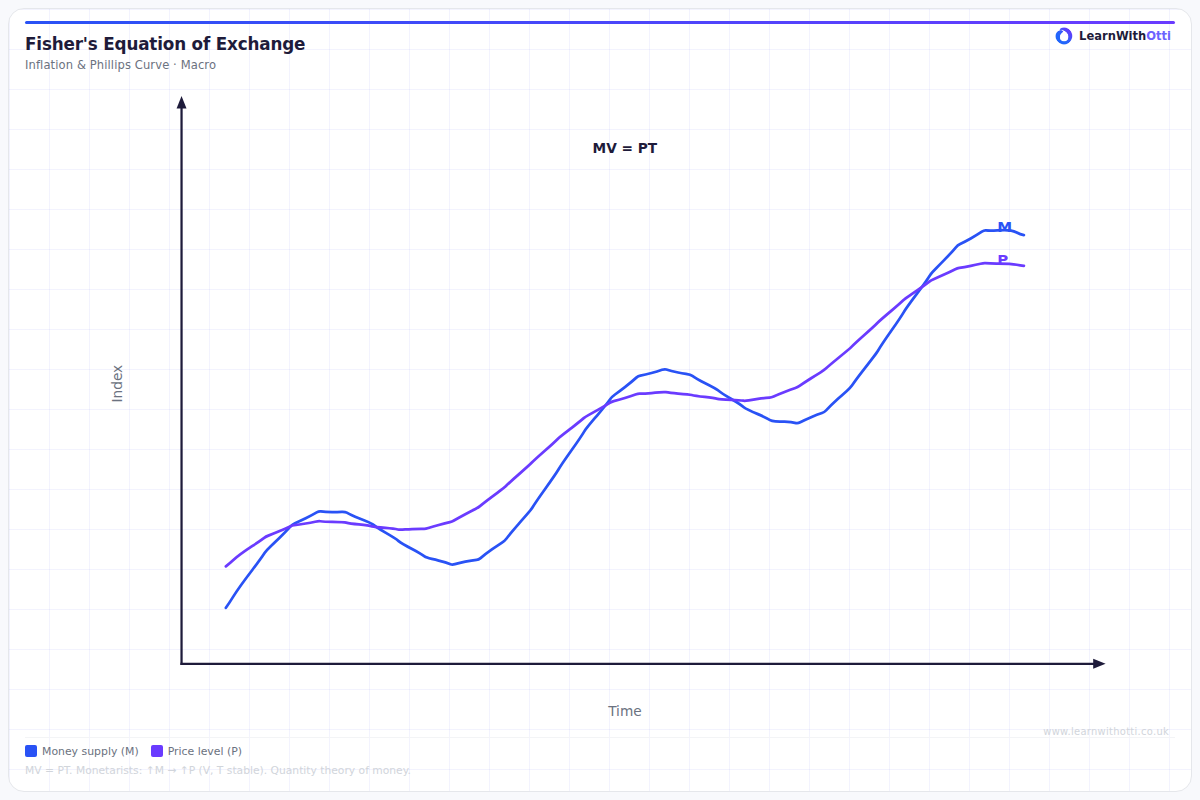
Diagram illustrating the quantity theory of money (MV = PQ), showing how increases in money supply translate into price level rises when velocity and output are fixed.
Printable preview
Download a static PNG of this diagram to print or include in revision notes.
Download PNGWhat this diagram shows
Fisher's Equation of Exchange (MV = PQ) shows the relationship between money supply and price levels in an economy. M represents the money supply, V is the velocity of circulation (how many times money changes hands), P is the average price level, and Q is the quantity of goods and services produced. This equation is fundamental to understanding how monetary policy affects inflation and economic activity, as it demonstrates that increases in money supply can lead to higher prices if velocity and output remain constant.
Key points
- MV = PQ is an identity where M = money supply, V = velocity of circulation, P = price level, Q = real output
- The equation suggests that if money supply (M) increases while V and Q remain constant, the price level (P) must rise proportionally
- Velocity (V) measures how frequently money circulates through the economy - higher velocity means the same amount of money facilitates more transactions
- Monetarists use this equation to argue that controlling money supply is key to controlling inflation
- The equation assumes velocity is stable and output is at full employment, which Keynesians challenge
Exam tip
Examiners love when students explain that MV = PQ is an identity, not a behavioural equation - it's true by definition. The most impressive answers discuss how different economists disagree about the stability and direction of causation between the variables, particularly whether changes in M directly cause changes in P.
Common mistakes
Students often assume that an increase in money supply automatically leads to proportional inflation, ignoring that velocity can change or that output might increase instead. They also confuse this identity with a causal relationship, when it's simply an accounting framework.
Exam board notes
All major exam boards treat this diagram identically, though OCR tends to place slightly more emphasis on the monetarist interpretation while AQA gives equal weight to Keynesian criticisms of the equation's assumptions.
Related diagrams
Ask Otti about this diagram
Our AI tutor can walk you through every curve, explain exam technique, and quiz you on it.