Long-Run Phillips Curve (LRPC)
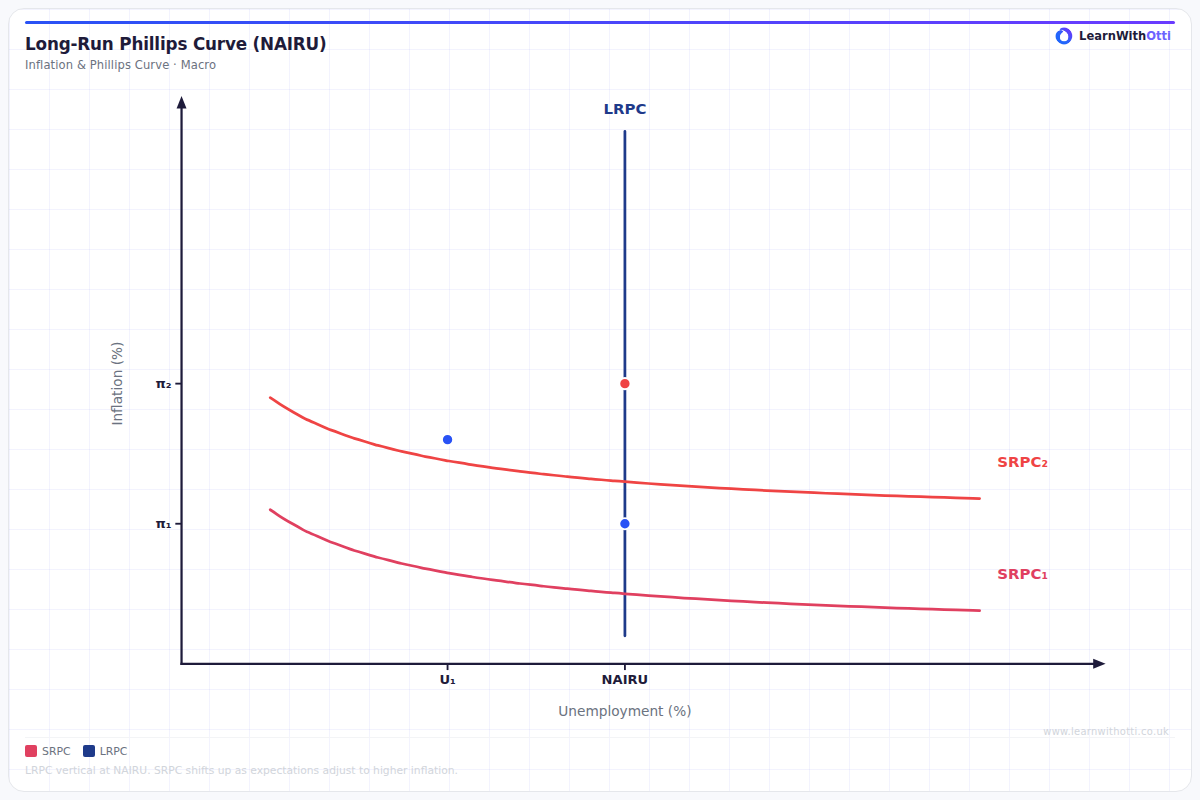
Vertical long-run Phillips Curve at the natural rate of unemployment (NAIRU), showing that there is no long-run trade-off between inflation and unemployment.
Printable preview
Download a static PNG of this diagram to print or include in revision notes.
Download PNGWhat this diagram shows
The Long-Run Phillips Curve (LRPC) shows the relationship between inflation and unemployment when the economy has fully adjusted to changes in the price level. Unlike the short-run Phillips curve which slopes downward, the LRPC is vertical at the natural rate of unemployment (NAIRU). This demonstrates that in the long run, there is no trade-off between inflation and unemployment - attempts to permanently reduce unemployment below its natural rate will only result in higher inflation. The vertical LRPC is crucial for understanding why monetary policy cannot permanently reduce unemployment below its natural level.
Key points
- The LRPC is perfectly vertical at the natural rate of unemployment (NAIRU), showing no long-run trade-off between inflation and unemployment
- Any attempt to maintain unemployment below the natural rate leads to accelerating inflation as workers and firms adjust their expectations
- The position of the LRPC can only shift if structural factors change the natural rate of unemployment (e.g., skills training, labor market reforms)
- Multiple short-run Phillips curves intersect the vertical LRPC, each representing different inflation expectations
- The LRPC supports the view that monetary policy should focus on price stability rather than employment targets in the long run
Exam tip
Always explain that the LRPC is vertical because in the long run, unemployment returns to its natural rate regardless of inflation - this shows no permanent trade-off exists. Examiners are impressed when students link this to expectations theory and explain why short-run Phillips curves shift.
Common mistakes
Students often confuse the LRPC with the short-run Phillips curve and incorrectly draw it with a downward slope. They also frequently forget to explain why it's vertical, missing the crucial point about expectations adjustment and the natural rate of unemployment.
Exam board notes
All major exam boards treat this diagram identically, emphasizing the vertical nature of the LRPC and its relationship with the natural rate of unemployment. Some specifications place slightly more emphasis on the policy implications and expectations theory behind the curve.
Related diagrams
Ask Otti about this diagram
Our AI tutor can walk you through every curve, explain exam technique, and quiz you on it.