Short-Run Phillips Curve (SRPC)
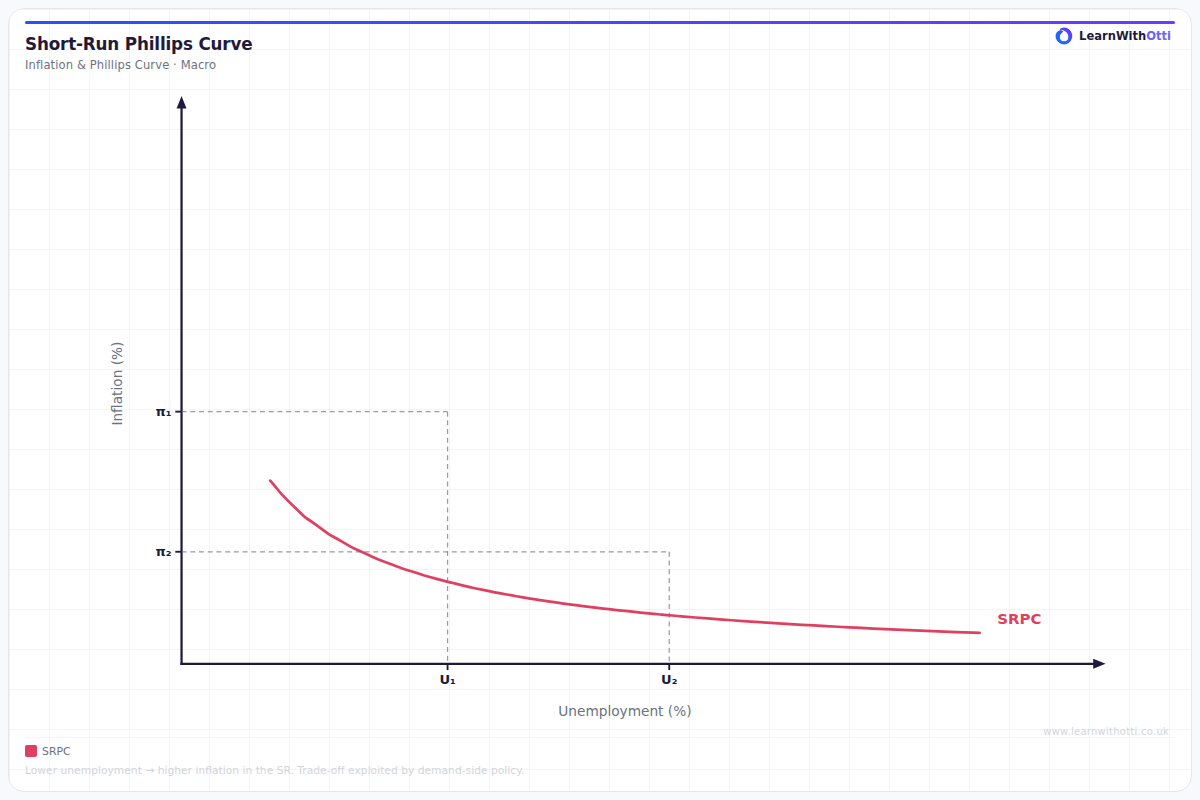
Short-run Phillips Curve showing the inverse trade-off between inflation and unemployment — lower unemployment is associated with higher inflation in the short run.
Printable preview
Download a static PNG of this diagram to print or include in revision notes.
Download PNGWhat this diagram shows
The Short-Run Phillips Curve demonstrates the inverse relationship between inflation and unemployment rates when inflation expectations remain constant. It suggests that policymakers can temporarily reduce unemployment by accepting higher inflation, or reduce inflation by tolerating higher unemployment. This trade-off occurs because workers and firms have fixed expectations about future price levels, so unexpected changes in inflation can temporarily affect real wages and employment decisions. Understanding this diagram is crucial for analyzing monetary policy decisions and their short-term economic consequences.
Key points
- Shows an inverse (negative) relationship between inflation rate (y-axis) and unemployment rate (x-axis)
- The trade-off only exists in the short run when inflation expectations are held constant
- Movement along the curve represents policy choices - stimulating the economy moves up-left (lower unemployment, higher inflation)
- The curve's position depends on expected inflation - if expectations change, the entire curve shifts
- The natural rate of unemployment occurs where the curve intersects the long-run Phillips curve (vertical line)
Exam tip
Always emphasize that the SRPC shows a trade-off that only exists in the short run when inflation expectations are fixed. Examiners are impressed when students explicitly state the assumption of constant inflation expectations and explain why this makes the trade-off temporary.
Common mistakes
Students often forget to mention that inflation expectations must be constant for the SRPC relationship to hold. They also frequently confuse movements along the curve (policy-induced changes) with shifts of the entire curve (changes in expectations).
Exam board notes
All major exam boards treat this diagram identically, emphasizing the temporary nature of the trade-off and the importance of inflation expectations. Some specifications may place slightly more emphasis on the mathematical relationship, but the core concepts remain consistent.
Related diagrams
Ask Otti about this diagram
Our AI tutor can walk you through every curve, explain exam technique, and quiz you on it.