Inflation Expectations Shift (SRPC)
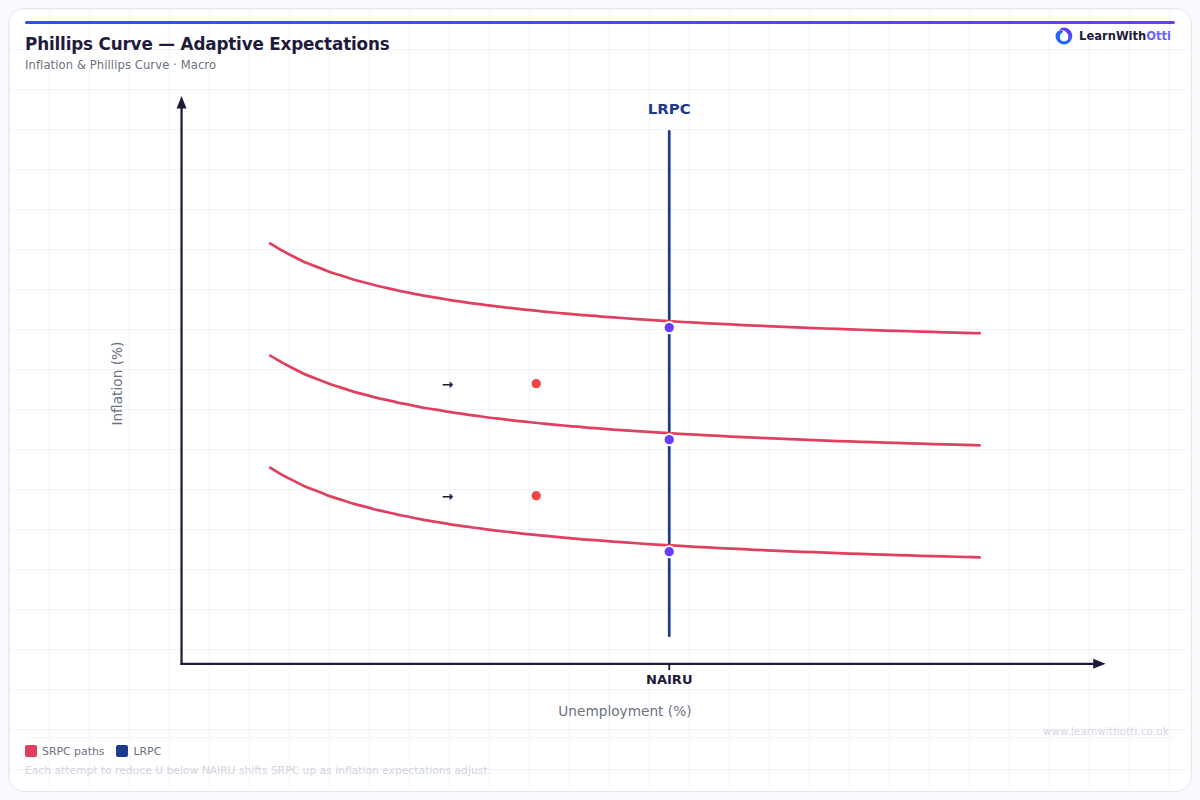
Phillips Curve diagram showing an upward shift of the SRPC due to higher inflation expectations, illustrating the expectations-augmented Phillips Curve adjustment process.
Printable preview
Download a static PNG of this diagram to print or include in revision notes.
Download PNGWhat this diagram shows
This diagram shows how the Short-Run Phillips Curve (SRPC) shifts when people's expectations about future inflation change. When inflation expectations increase, the entire SRPC shifts upward because workers demand higher wages and firms set higher prices even at the same unemployment rate. This demonstrates why controlling inflation expectations is crucial for policymakers - if people expect higher inflation, it becomes a self-fulfilling prophecy that makes the inflation-unemployment trade-off worse.
Key points
- Higher inflation expectations shift the entire SRPC upward and to the right
- At any given unemployment rate, actual inflation will be higher when expectations increase
- The shift occurs because workers demand higher wages and firms set higher prices based on expected inflation
- Lower inflation expectations shift the SRPC downward, improving the trade-off between inflation and unemployment
- This explains why central bank credibility in keeping inflation low is so important for economic policy
Exam tip
Students often forget that the entire SRPC curve shifts when expectations change - don't just move along the curve! Examiners are impressed when you clearly explain that the shift occurs because workers and firms adjust their wage and price-setting behaviour based on what they expect inflation to be.
Common mistakes
Students frequently confuse movements along the SRPC with shifts of the entire curve - remember that changing expectations shifts the whole curve. Another error is failing to explain the mechanism: expectations affect wage bargaining and price-setting decisions, which then affect actual inflation.
Exam board notes
All major exam boards treat this diagram identically, focusing on the relationship between expectations and the Phillips Curve trade-off. Some boards may emphasise the policy implications more heavily in their mark schemes.
Related diagrams
Ask Otti about this diagram
Our AI tutor can walk you through every curve, explain exam technique, and quiz you on it.