AD/AS Diagram — Classical / Monetarist Model
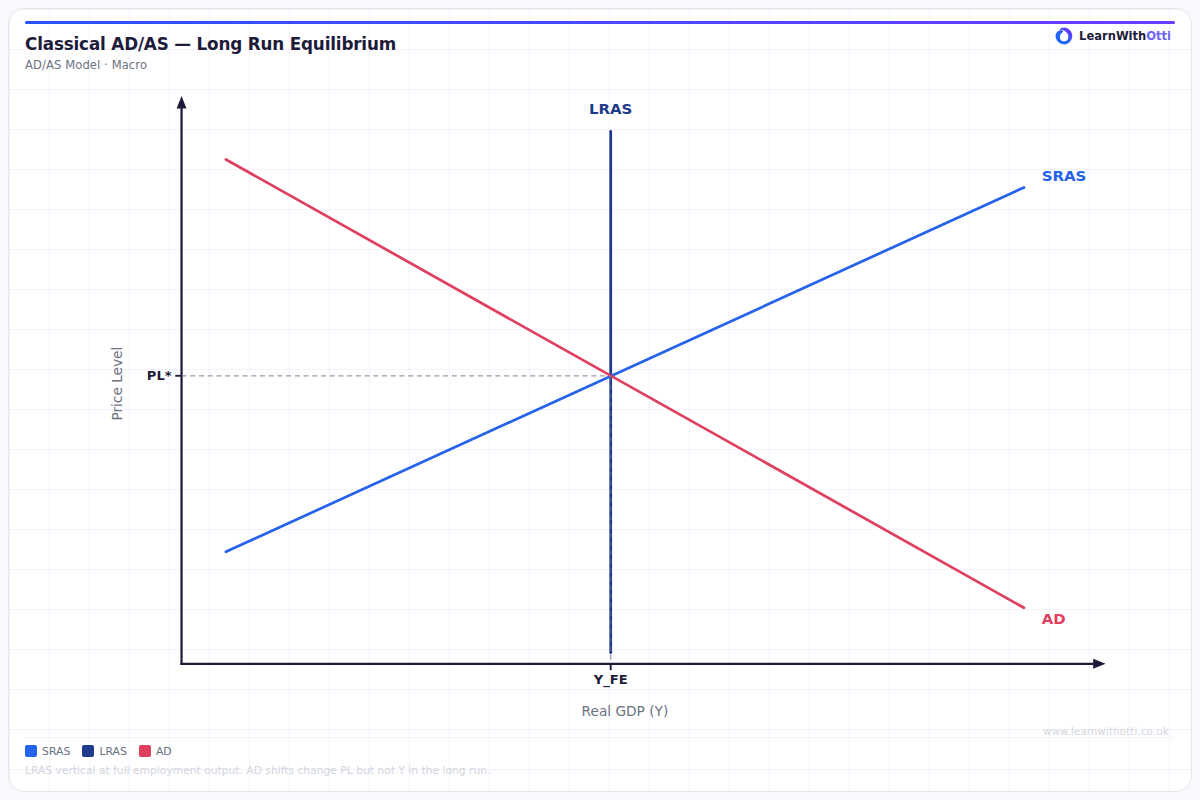
Classical AD/AS diagram with a vertical LRAS at the natural rate of output, showing that demand shocks only affect the price level in the long run.
Printable preview
Download a static PNG of this diagram to print or include in revision notes.
Download PNGWhat this diagram shows
The Classical/Monetarist AD/AS model shows how the economy operates when markets clear efficiently and prices are flexible. The key feature is the vertical Long Run Aggregate Supply (LRAS) curve, which represents the economy's maximum sustainable output when all resources are fully employed. This model suggests that changes in aggregate demand only affect the price level in the long run, not real output, as the economy automatically returns to full employment equilibrium through flexible wages and prices.
Key points
- LRAS is perfectly vertical at full employment output (Yfe), showing output is determined by factors of production, not demand
- Short run AS curve is upward sloping due to sticky wages/prices, but economy moves to long run equilibrium automatically
- Increases in AD only cause inflation in the long run - no permanent increase in real output
- The model assumes flexible wages and prices, perfect information, and markets that clear efficiently
- Supply-side policies can shift LRAS rightward, increasing potential output and economic growth
Exam tip
Always clearly label the vertical LRAS curve and explain that it represents full employment output - this is the key distinguishing feature from Keynesian models. Examiners are impressed when students can explain why the LRAS is vertical (factors of production are fully employed) and link this to Say's Law.
Common mistakes
Students often draw the LRAS curve as upward sloping rather than perfectly vertical, failing to understand that classical economists believe output is supply-determined. Another error is not explaining why AD shifts only affect prices in the long run, missing the automatic adjustment mechanism.
Exam board notes
All major exam boards treat this diagram identically, though OCR tends to emphasize the philosophical differences between Classical and Keynesian approaches more heavily. AQA and Edexcel focus more on the policy implications of the vertical LRAS assumption.
Related diagrams
Ask Otti about this diagram
Our AI tutor can walk you through every curve, explain exam technique, and quiz you on it.