AD Shift Right — Classical (At Full Employment)
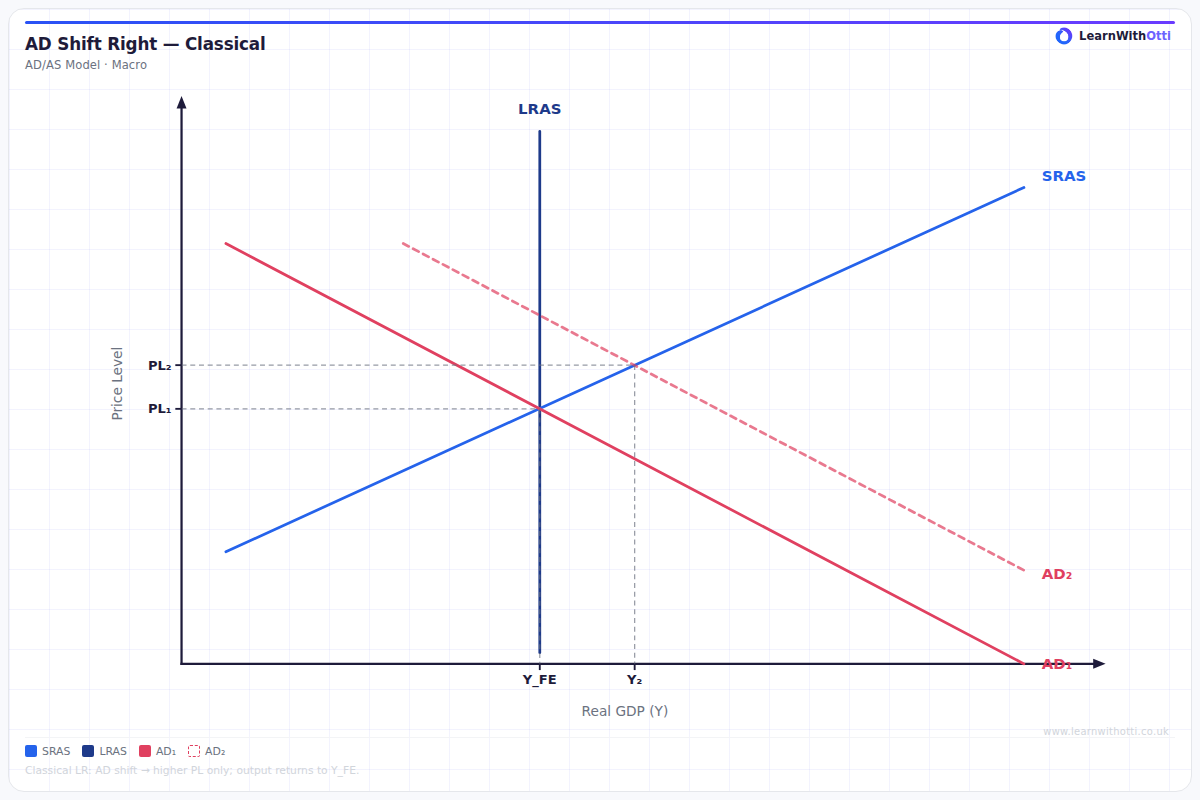
Classical AD/AS diagram showing a rightward AD shift at full employment, causing only a rise in the price level with no permanent increase in real output.
Printable preview
Download a static PNG of this diagram to print or include in revision notes.
Download PNGWhat this diagram shows
This diagram demonstrates what happens in the classical model when aggregate demand increases while the economy is already operating at full employment capacity. The vertical Long-Run Aggregate Supply (LRAS) curve shows that real output cannot increase beyond the full employment level, regardless of demand changes. When AD shifts right, the economy moves to a new equilibrium with a higher price level but the same level of real GDP. This illustrates the classical view that demand-side policies are ineffective at increasing output in the long run and only create inflation.
Key points
- The LRAS curve is perfectly vertical at full employment level of output (Yfe), showing output cannot increase further
- Rightward shift in AD leads to movement from equilibrium point A to point B, with higher price level (P1 to P2)
- Real GDP remains unchanged at the full employment level despite increased aggregate demand
- The result is pure inflation - all the increase in nominal demand translates into higher prices
- This demonstrates the classical argument that fiscal/monetary stimulus is ineffective when the economy is at full capacity
Exam tip
Examiners are impressed when students explicitly state that in the classical model, the LRAS curve is perfectly vertical because the economy is already at full employment. Common errors include drawing the LRAS as upward-sloping or failing to explain why only price level changes with no change in real output.
Common mistakes
Students often incorrectly draw the LRAS curve as upward-sloping rather than perfectly vertical, suggesting that output can still increase. They also frequently fail to emphasize that this model assumes the economy starts at full employment, making the analysis invalid if there is spare capacity.
Exam board notes
All major exam boards treat this diagram identically, though AQA tends to emphasize the policy implications more heavily in mark schemes. Some specifications may refer to this as the 'monetarist' rather than 'classical' view, but the analysis remains the same.
Related diagrams
Ask Otti about this diagram
Our AI tutor can walk you through every curve, explain exam technique, and quiz you on it.