AD Shift Left — Recession
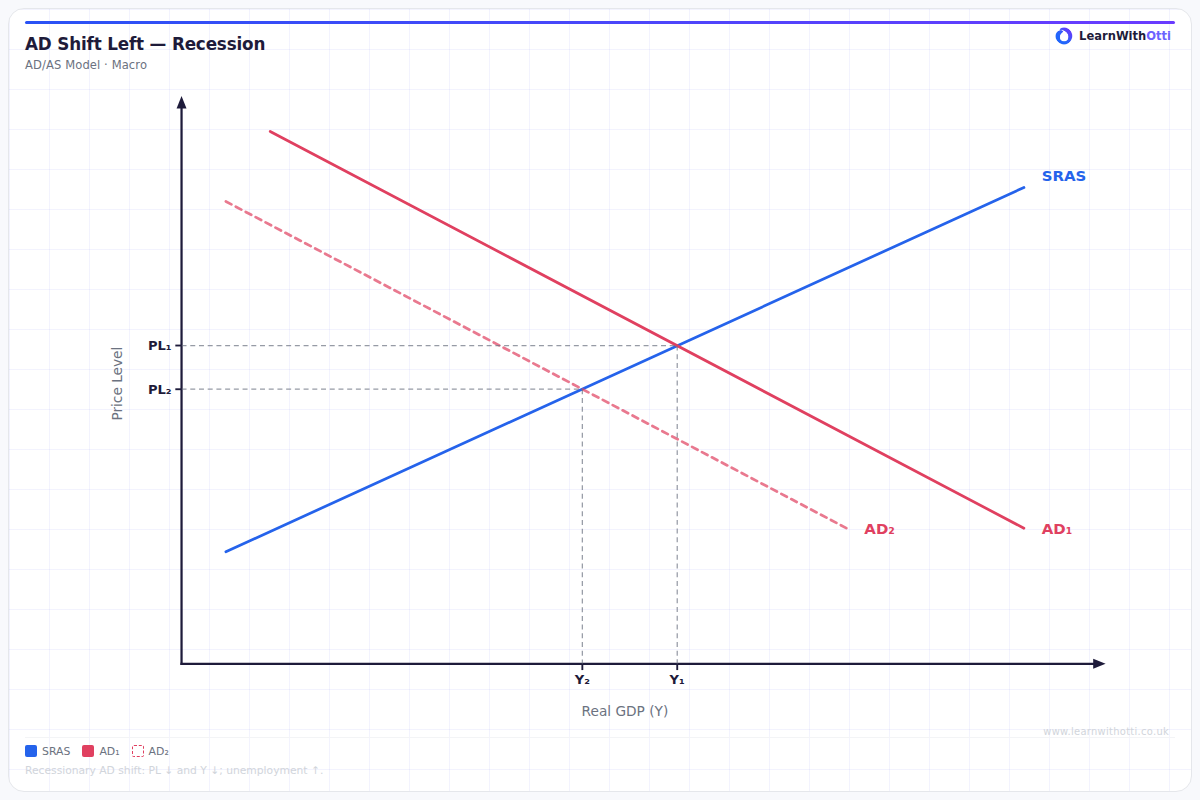
AD/AS diagram showing a leftward AD shift causing a fall in real GDP and a negative output gap, illustrating recession and demand-deficient unemployment.
Printable preview
Download a static PNG of this diagram to print or include in revision notes.
Download PNGWhat this diagram shows
This diagram shows what happens when aggregate demand shifts leftward from AD1 to AD2, typically caused by factors like falling consumer confidence, reduced investment, or contractionary government policy. The economy moves from the original equilibrium to a new equilibrium with lower real GDP and lower price levels. This represents a recession - a period of negative economic growth where output falls below the economy's previous level. The diagram illustrates how demand-side shocks can push an economy into recession through the multiplier effect.
Key points
- The leftward shift of AD is caused by falls in consumption (C), investment (I), government spending (G), or net exports (X-M)
- The new equilibrium shows both lower real GDP (recession) and lower price levels (deflation or disinflation)
- The size of the GDP fall depends on the slope of AS - steeper AS curves mean larger output effects
- This represents a demand-deficient recession, where the problem is insufficient spending in the economy
- The multiplier effect amplifies the initial fall in spending, making the final GDP reduction larger than the original shift
Exam tip
Always explain the shift mechanism carefully - it's the fall in components of AD (C, I, G, or X-M) that causes the leftward shift, not the recession itself. Examiners are impressed when you link specific real-world factors (like falling consumer confidence or rising interest rates) to the shift and then trace through the multiplier effects.
Common mistakes
Students often confuse cause and effect, incorrectly stating that recession causes AD to shift left, when it's actually the leftward shift that causes the recession. Many also forget to explain what specifically caused the shift, simply stating 'AD shifts left' without identifying which component(s) of AD fell and why.
Exam board notes
All major exam boards treat this diagram identically, though AQA tends to emphasize policy responses more heavily while OCR often links it more explicitly to business cycle analysis.
Related diagrams
Ask Otti about this diagram
Our AI tutor can walk you through every curve, explain exam technique, and quiz you on it.