First-Degree (Perfect) Price Discrimination
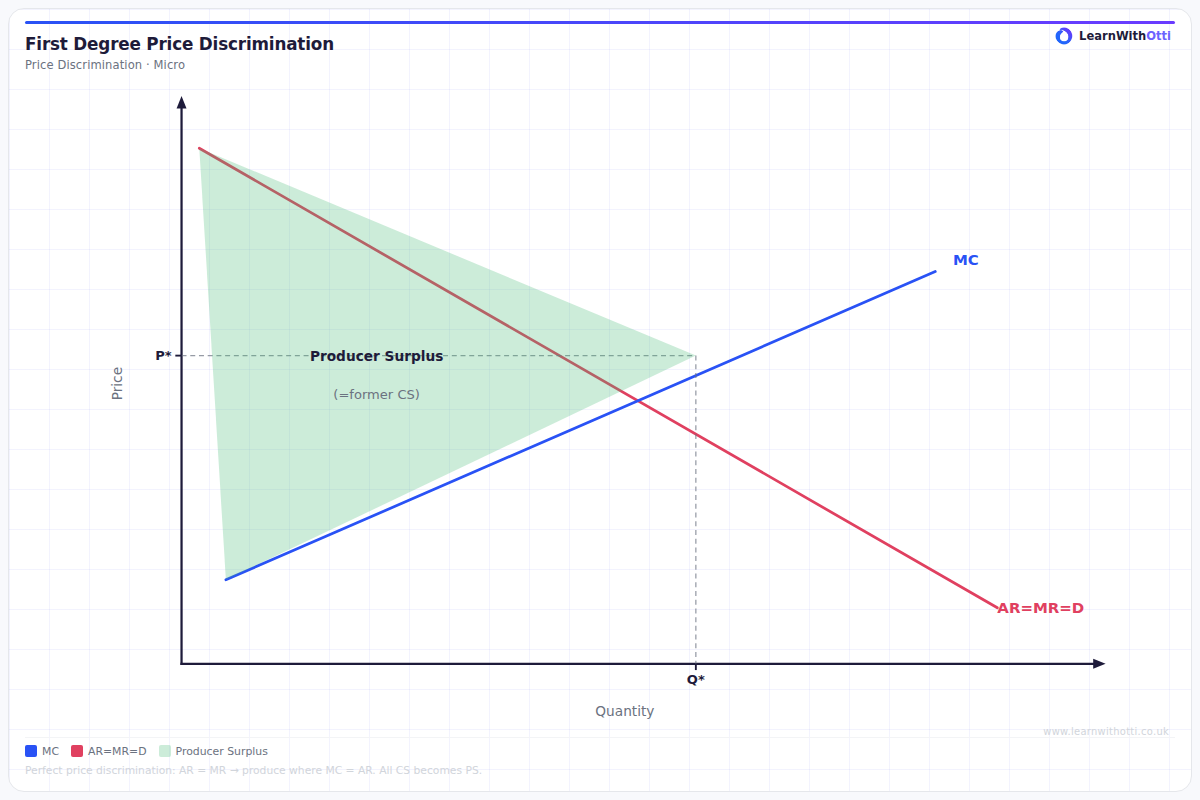
Diagram showing a monopolist extracting all consumer surplus by charging each consumer their maximum willingness to pay, eliminating the deadweight loss.
Printable preview
Download a static PNG of this diagram to print or include in revision notes.
Download PNGWhat this diagram shows
First-degree price discrimination occurs when a monopolist charges each consumer the maximum price they are willing to pay for each unit consumed. This means the firm captures all consumer surplus by charging different prices to different consumers based on their individual demand curves. The result is that the monopolist's marginal revenue curve becomes identical to the market demand curve, leading to allocatively efficient output levels but zero consumer surplus.
Key points
- The firm charges each consumer their maximum willingness to pay, meaning price varies for every unit sold
- Consumer surplus is completely eliminated and transferred to producer surplus
- Output level matches the allocatively efficient outcome (where P = MC) unlike single-price monopoly
- Marginal revenue equals price for each unit since no price reduction is needed to sell additional units
- Requires perfect information about consumer preferences and ability to prevent resale
Exam tip
Students often forget to explain that first-degree price discrimination requires perfect information about each consumer's willingness to pay. Examiners are impressed when you clearly show that consumer surplus is completely eliminated and transferred to producer surplus, making this the most profitable form of price discrimination.
Common mistakes
Students often confuse this with third-degree price discrimination and incorrectly show different consumer groups rather than individual pricing. They also frequently forget to show that the deadweight loss is eliminated compared to single-price monopoly.
Exam board notes
All major exam boards treat this diagram identically. However, CIE tends to place slightly more emphasis on the welfare implications and efficiency outcomes compared to other boards.
Related diagrams
Ask Otti about this diagram
Our AI tutor can walk you through every curve, explain exam technique, and quiz you on it.