Third-Degree Price Discrimination
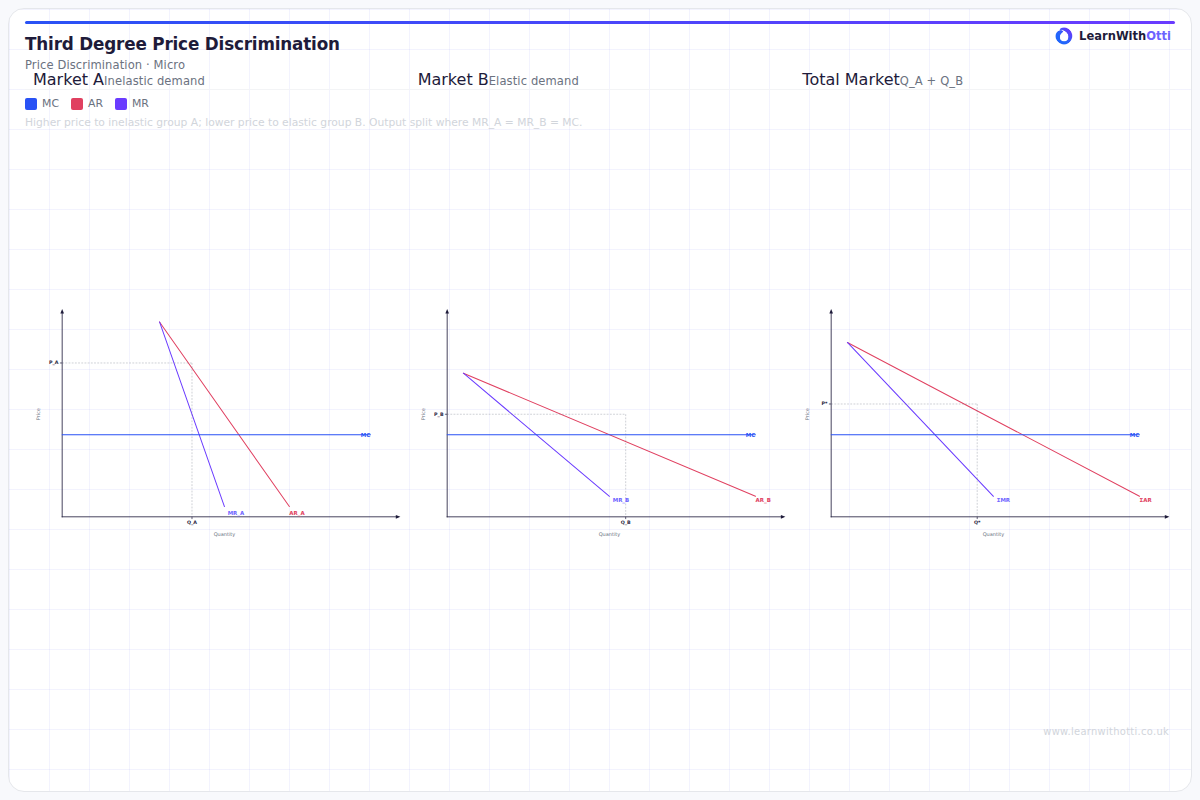
Diagram showing market segmentation into two groups with different PEDs, with the firm charging a higher price in the inelastic segment and lower in the elastic segment.
Printable preview
Download a static PNG of this diagram to print or include in revision notes.
Download PNGWhat this diagram shows
This diagram shows third-degree price discrimination where a monopolist charges different prices to different consumer groups with varying price elasticities of demand. The firm maximizes profit by setting MR1 = MR2 = MC, allocating output between markets until marginal revenue is equal across both segments. Market 1 (less elastic demand) receives a higher price than Market 2 (more elastic demand), allowing the firm to capture more consumer surplus as profit. This strategy increases total revenue and profit compared to charging a single price across all consumers.
Key points
- The firm must have market power and be able to prevent resale between market segments
- Markets are separated by different price elasticities of demand - less elastic markets face higher prices
- Profit maximization occurs where MR1 = MR2 = MC, with total output allocated between markets
- The price difference between markets depends on the relative elasticities: more elastic demand leads to lower prices
- Consumer surplus decreases overall, but some consumers in the elastic market may benefit from lower prices than under uniform pricing
Exam tip
Examiners are impressed when students clearly explain that third-degree price discrimination requires the firm to separate markets with different price elasticities of demand. The most common error is failing to show that MR1 + MR2 = MC at the profit-maximizing output level, so always demonstrate this equilibrium condition clearly.
Common mistakes
Students often incorrectly assume the firm simply charges whatever price it wants in each market, rather than following the MR = MC rule. Many also fail to recognize that the market with more elastic demand will always receive the lower price.
Exam board notes
All major exam boards treat this diagram identically, focusing on the profit maximization condition and the relationship between price elasticity and price levels. Some specifications may emphasize real-world examples like student discounts or geographic pricing more than others.
Related diagrams
Ask Otti about this diagram
Our AI tutor can walk you through every curve, explain exam technique, and quiz you on it.