Price Elasticity of Demand — Elastic
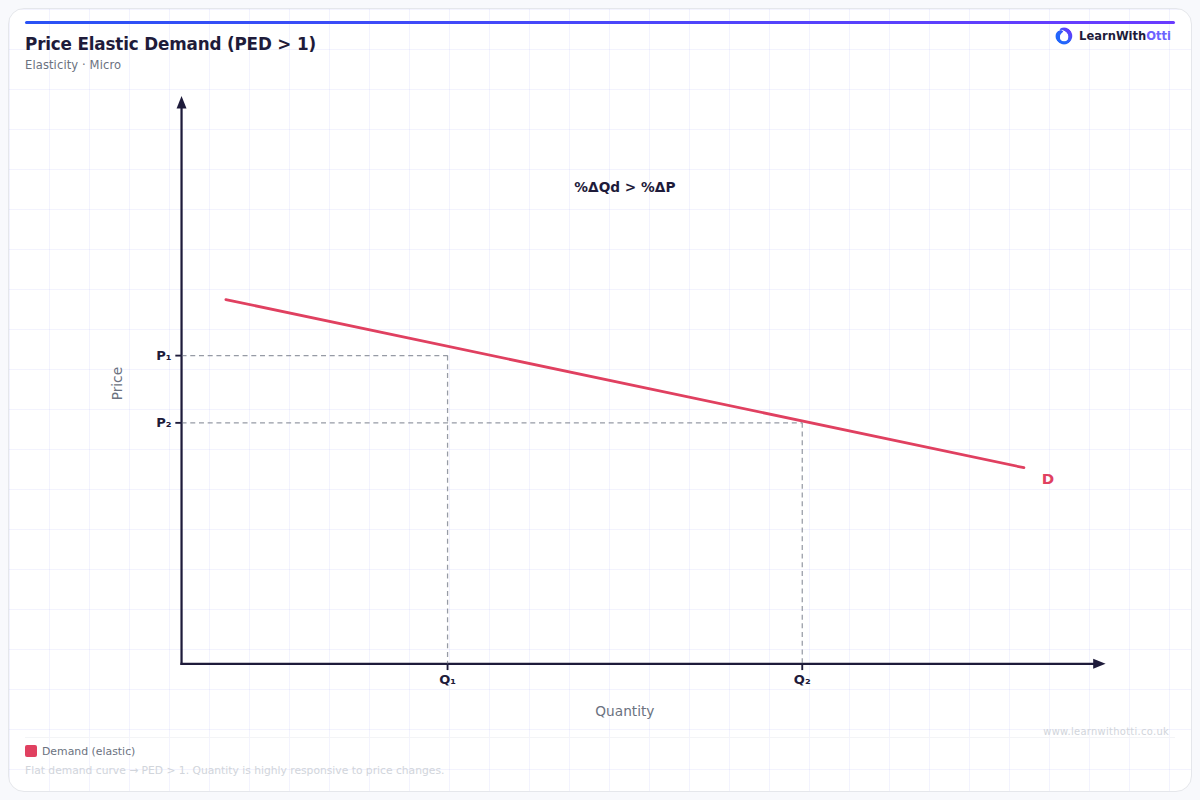
Demand curve with PED > 1 (elastic), showing that a given percentage price rise leads to a larger percentage fall in quantity demanded. Revenue falls when price rises.
Printable preview
Download a static PNG of this diagram to print or include in revision notes.
Download PNGWhat this diagram shows
This diagram shows elastic price elasticity of demand, where the demand curve is relatively flat and the PED coefficient is greater than 1 (ignoring the negative sign). When demand is elastic, consumers are highly responsive to price changes - a small percentage change in price leads to a larger percentage change in quantity demanded. This has crucial implications for business revenue decisions, as price increases will actually reduce total revenue when demand is elastic.
Key points
- The demand curve is relatively flat/shallow, indicating high responsiveness to price changes
- PED coefficient is greater than 1 (in absolute terms), meaning % change in quantity > % change in price
- A price increase leads to a proportionally larger fall in quantity demanded, reducing total revenue
- A price decrease leads to a proportionally larger rise in quantity demanded, increasing total revenue
- Common for luxury goods, goods with many substitutes, or goods that take up a large proportion of income
Exam tip
Always remember that elastic demand curves are relatively flat, not steep - this is the opposite of what many students intuitively think. Examiners are impressed when students can quickly identify that PED > 1 means consumers are highly responsive to price changes, leading to proportionally larger changes in quantity demanded.
Common mistakes
Students often confuse the visual appearance, thinking elastic demand curves should be steep when they're actually flat. Many also forget that elastic demand means businesses should lower prices to increase revenue, not raise them.
Exam board notes
All major exam boards treat this diagram identically. However, CIE sometimes places slightly more emphasis on calculating exact PED coefficients from the diagram, while AQA and Edexcel focus more on the revenue implications.
Related diagrams
Ask Otti about this diagram
Our AI tutor can walk you through every curve, explain exam technique, and quiz you on it.