Price Elasticity of Demand — Perfectly Elastic
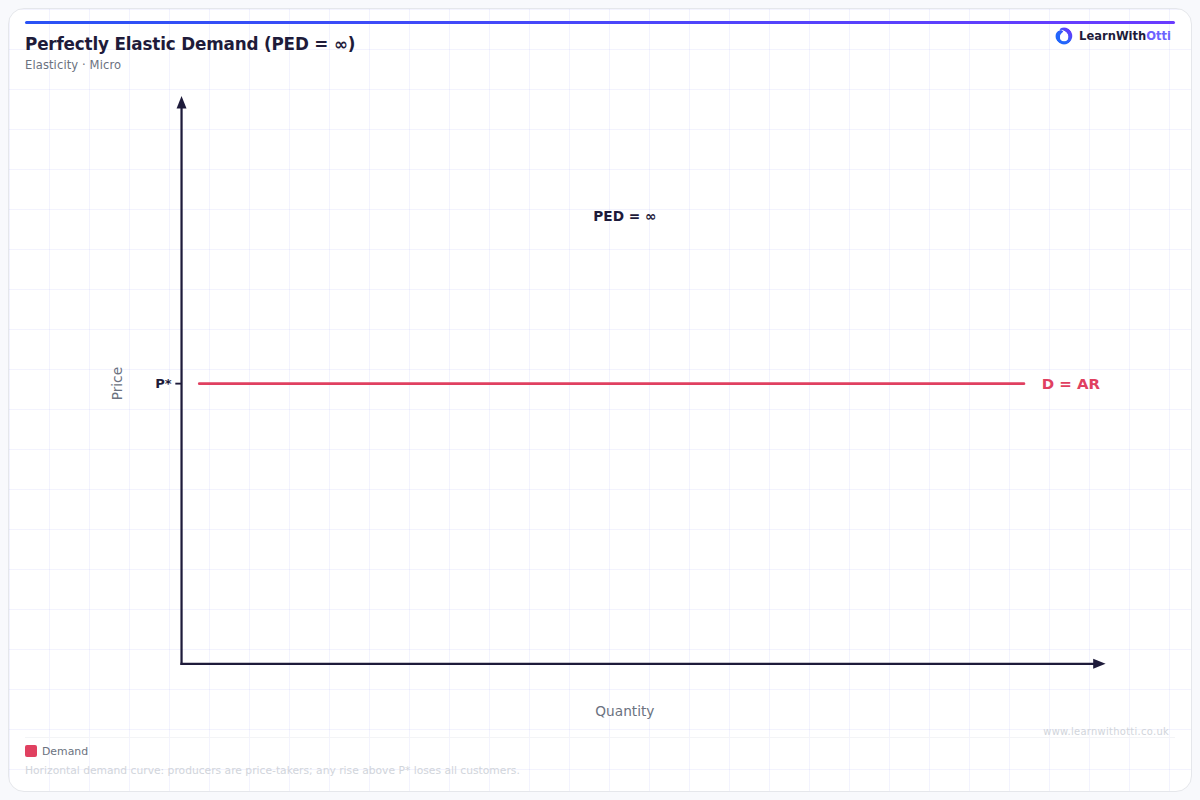
Horizontal demand curve showing perfectly elastic demand (PED = ∞). Any price rise above the market price causes quantity demanded to fall to zero.
Printable preview
Download a static PNG of this diagram to print or include in revision notes.
Download PNGWhat this diagram shows
The perfectly elastic demand curve appears as a horizontal line, showing that consumers will buy any quantity at one specific price but nothing at any higher price. This represents a situation where price elasticity of demand is infinite - even the tiniest price increase causes demand to fall to zero. This theoretical extreme is most commonly seen in perfectly competitive markets where products are identical and consumers have perfect information, making them extremely price-sensitive.
Key points
- The demand curve is perfectly horizontal, indicating infinite price elasticity (PED = ∞)
- Any price increase above the market price causes quantity demanded to fall to zero instantly
- Firms are 'price takers' and must accept the market price - they cannot set their own prices
- Most commonly occurs in perfectly competitive markets with homogeneous products
- Real-world examples include foreign exchange markets and commodity markets where products are identical
Exam tip
Students often confuse perfectly elastic demand with perfectly inelastic demand - remember that perfectly elastic means consumers are extremely sensitive to price changes. Examiners are impressed when you can explain that this horizontal line represents infinite price elasticity (PED = ∞) and give realistic examples like foreign exchange markets or perfectly competitive markets.
Common mistakes
Students frequently draw the curve with a slight slope instead of making it perfectly horizontal, which changes the meaning entirely. They also confuse this with perfectly inelastic demand, mixing up the horizontal and vertical orientations.
Exam board notes
All major exam boards treat this diagram identically as part of their elasticity coverage. The concept appears consistently across AQA, Edexcel, OCR and CIE specifications within their market structures and elasticity topics.
Related diagrams
Ask Otti about this diagram
Our AI tutor can walk you through every curve, explain exam technique, and quiz you on it.