Price Elasticity of Demand — Unitary
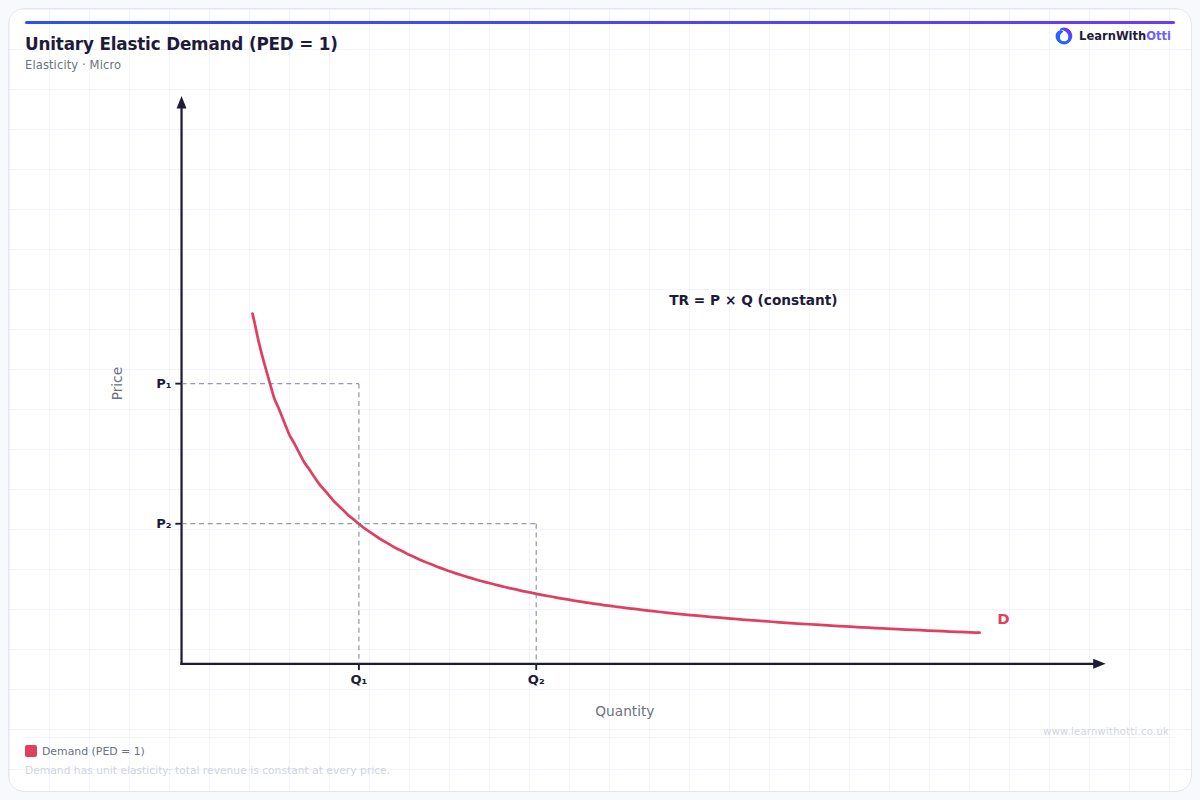
Demand curve with PED = 1, where percentage change in price equals percentage change in quantity demanded. Total revenue remains unchanged when price changes.
Printable preview
Download a static PNG of this diagram to print or include in revision notes.
Download PNGWhat this diagram shows
A unitary elastic demand curve shows where the price elasticity of demand equals exactly -1 at every point along the curve. This means that any percentage change in price leads to an exactly equal but opposite percentage change in quantity demanded. The curve appears as a rectangular hyperbola, and crucially, total revenue (P × Q) remains constant at every point along this demand curve, making it economically significant for businesses trying to maximise revenue.
Key points
- PED = -1 at every single point along the curve, not just at one point
- Total revenue remains constant along the entire curve because price and quantity changes exactly offset each other
- The demand curve is a rectangular hyperbola (curved, not straight like other elasticity diagrams)
- A 10% increase in price leads to exactly a 10% decrease in quantity demanded
- This represents the boundary between elastic (PED > 1) and inelastic (PED < 1) demand
Exam tip
Students often forget that unitary elasticity means PED = -1 exactly, not approximately -1. Examiners are impressed when you explain that total revenue remains constant along a unitary elastic demand curve because the percentage change in price is exactly offset by the opposite percentage change in quantity demanded.
Common mistakes
Students frequently confuse unitary elasticity with perfectly elastic or inelastic demand, mixing up the shapes of these curves. They also wrongly assume that because total revenue is constant, profit must also be constant, forgetting that costs may change as output changes.
Exam board notes
All major exam boards treat this diagram identically. However, OCR tends to ask more mathematical questions requiring students to calculate specific points on the unitary elastic curve, while AQA focuses more on the theoretical implications for business revenue decisions.
Related diagrams
Ask Otti about this diagram
Our AI tutor can walk you through every curve, explain exam technique, and quiz you on it.