Price Elasticity of Demand — Perfectly Inelastic
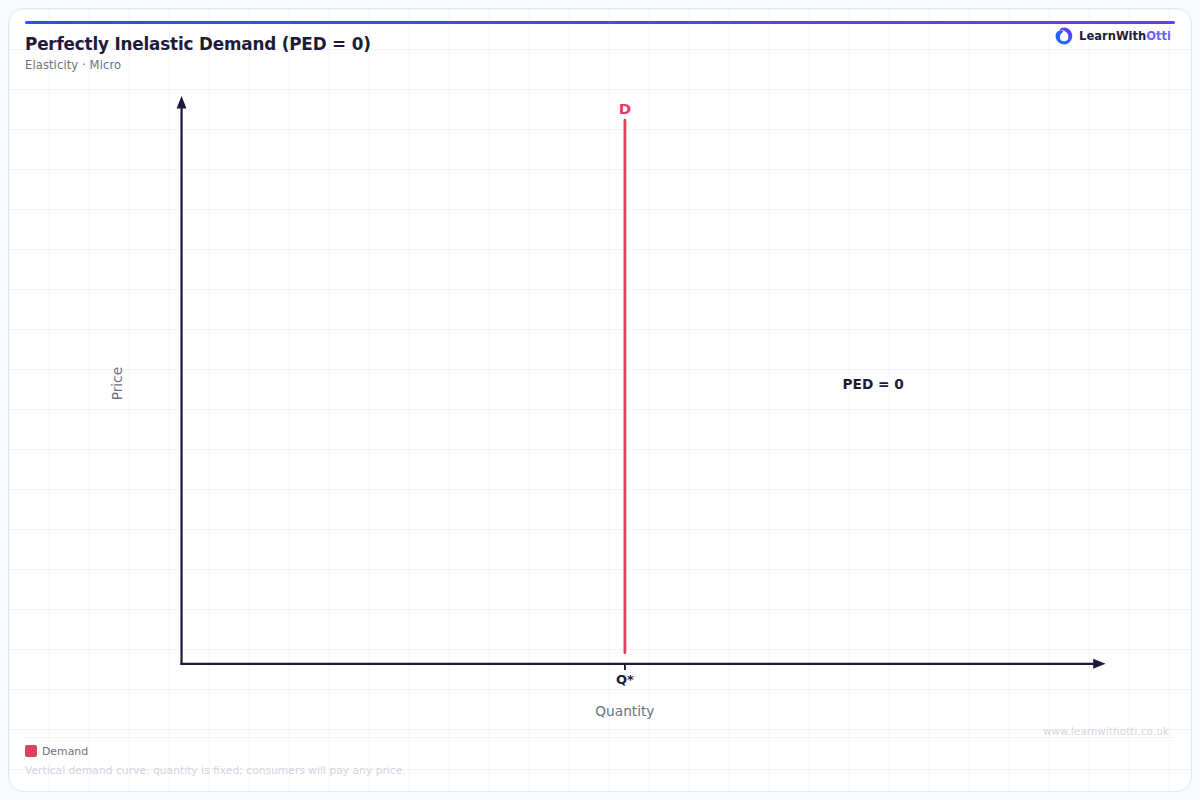
Vertical demand curve showing perfectly inelastic demand (PED = 0). Quantity demanded does not change regardless of the price level.
Printable preview
Download a static PNG of this diagram to print or include in revision notes.
Download PNGWhat this diagram shows
This diagram shows perfectly inelastic demand where the demand curve is a vertical straight line, indicating that quantity demanded remains completely unchanged regardless of price fluctuations. The price elasticity of demand coefficient equals zero (PED = 0), meaning consumers will purchase the same quantity whether prices rise or fall dramatically. This typically occurs with essential goods that have no substitutes, such as life-saving medications or addiction-related products. Understanding this extreme case helps students grasp how elasticity affects consumer behaviour and producer pricing strategies.
Key points
- The demand curve is perfectly vertical, showing zero responsiveness to price changes
- Price elasticity of demand coefficient equals exactly zero (PED = 0)
- Quantity demanded remains constant at all price levels shown on the diagram
- Total revenue increases proportionally with price increases since quantity stays fixed
- Occurs with essential goods having no substitutes, like insulin or life-saving drugs
Exam tip
Students often forget to clearly label the vertical demand curve as 'PED = 0' and fail to explain that quantity demanded remains constant regardless of price changes. Examiners are impressed when students can provide real-world examples like life-saving medicines or insulin, showing they understand the practical applications of perfectly inelastic demand.
Common mistakes
Students frequently confuse perfectly inelastic demand with perfectly elastic demand, mixing up the vertical and horizontal curves. They also mistakenly think that if price doubles, revenue doubles, without properly explaining that this only works because quantity demanded stays completely constant.
Exam board notes
All major exam boards treat this diagram identically, requiring students to demonstrate understanding of the vertical demand curve and PED = 0 coefficient. Some boards like AQA and Edexcel place slightly more emphasis on real-world applications in their mark schemes.
Related diagrams
Ask Otti about this diagram
Our AI tutor can walk you through every curve, explain exam technique, and quiz you on it.