Hysteresis — Lower Trend GDP After a Deep Recession
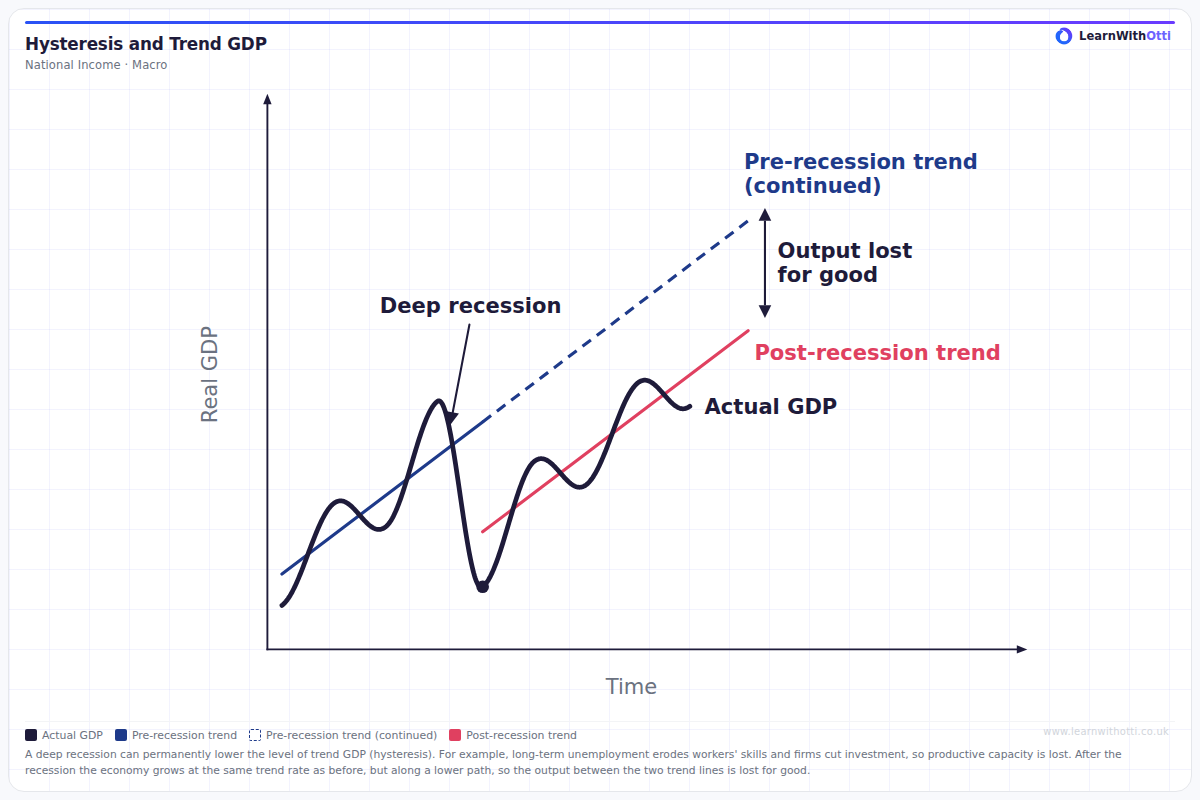
Diagram of hysteresis: a deep recession permanently lowers the level of trend GDP, so the economy then grows at the same trend rate along a lower path and some output is lost for good.
Printable preview
Download a static PNG of this diagram to print or include in revision notes.
Download PNGWhat this diagram shows
This diagram shows hysteresis: a deep recession that permanently lowers the level of trend GDP. Before the recession, actual GDP fluctuates around the pre-recession trend. A deep recession then cuts actual GDP sharply, and the damage is not only cyclical. Long-term unemployment erodes workers' skills and some leave the labour force, while firms cut investment and scrap capital, so the economy's productive capacity falls. After the trough, the economy grows at the same trend rate as before, but along a lower path, so actual GDP never gets back to the pre-recession trend. The vertical gap between the continued pre-recession trend and the post-recession trend is output that is lost for good.
Key points
- Hysteresis means a deep recession has a lasting effect on the economy's productive capacity, so trend GDP does not return to its pre-recession path.
- The post-recession trend is parallel to the pre-recession trend: the trend rate of growth is the same, but the level of trend GDP is permanently lower.
- The causes are on the supply side: workers lose skills during long-term unemployment, some workers become discouraged and leave the labour force, and firms cut investment and scrap capital.
- After the recession, actual GDP fluctuates around the lower post-recession trend and never gets back to the continued pre-recession trend.
- The gap between the continued pre-recession trend and the post-recession trend is output lost for good. This is why a deep recession can have long-run costs, not just short-run ones.
Exam tip
When you draw this diagram, keep the post-recession trend line parallel to the pre-recession trend line: hysteresis lowers the level of trend GDP, not its growth rate. Start the new trend line at the trough of the deep recession, continue the old trend as a dashed line, and label the vertical gap between the two lines as output lost for good. In your explanation, name the supply-side causes, such as workers losing skills during long-term unemployment and firms cutting investment.
Common mistakes
Students often confuse hysteresis with a long recession, or draw the post-recession trend with a lower slope. Hysteresis is a permanent fall in the level of trend GDP: the economy recovers and grows at the same trend rate as before, but from a lower path. Another mistake is to explain it only as a fall in demand: the lasting damage is to the supply side, through lost skills, discouraged workers and lower investment.
Related diagrams
Ask Otti about this diagram
Our AI tutor can walk you through every curve, explain exam technique, and quiz you on it.