AD Shift Left — Keynesian (Recession)
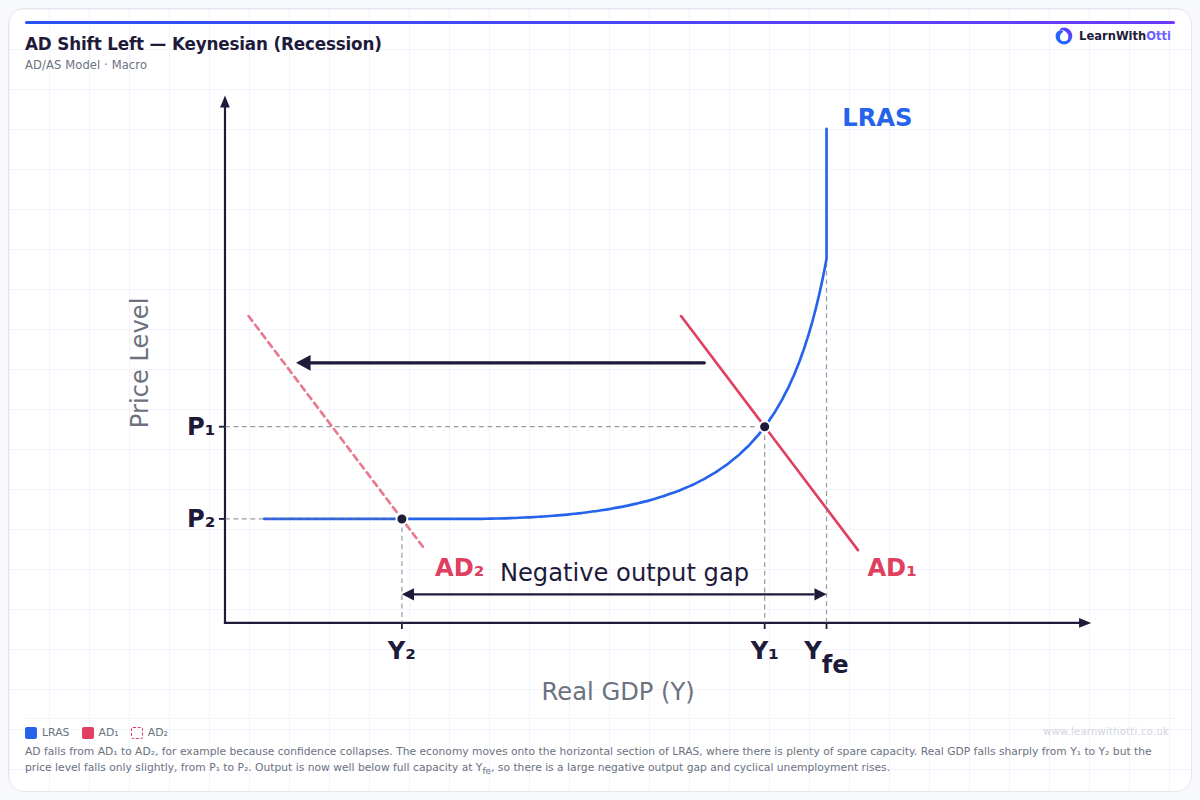
Keynesian AD/AS diagram showing AD shifting left from the upward-curving section of LRAS onto the horizontal section: real GDP falls sharply, the price level falls slightly and a negative output gap opens up.
Printable preview
Download a static PNG of this diagram to print or include in revision notes.
Download PNGWhat this diagram shows
This diagram shows aggregate demand (AD) shifting to the left, from AD₁ to AD₂, for example because consumer and business confidence collapses. The economy starts on the upward-curving section of the Keynesian LRAS curve and moves onto the horizontal section, where there is plenty of spare capacity. Real GDP falls sharply from Y₁ to Y₂, but the price level falls only slightly, from P₁ to P₂, because on the horizontal section firms can cut output without needing to cut prices much. Output is now well below full-employment output, Yfe, so a large negative output gap opens up and cyclical (demand-deficient) unemployment rises.
Key points
- AD shifts to the left, from AD₁ to AD₂: a decrease in aggregate demand, for example from a collapse in confidence, higher interest rates, lower government spending or lower net exports.
- LRAS does not shift; the economy moves down the Keynesian LRAS curve from the upward-curving section onto the horizontal section.
- Real GDP falls sharply, from Y₁ to Y₂, while the price level falls only slightly, from P₁ to P₂.
- The horizontal section of LRAS shows plenty of spare capacity: unemployed workers and unused capital.
- Output at Y₂ is well below full-employment output, Yfe, so there is a large negative output gap and cyclical unemployment rises.
Exam tip
When you draw this diagram, start AD₁ on the upward-curving section of the Keynesian LRAS curve and shift it left so that AD₂ cuts LRAS on the horizontal section. Mark Y₁, Y₂ and Yfe on the output axis, and show the negative output gap between Y₂ and Yfe. In your explanation, link the large fall in real GDP to spare capacity and rising cyclical unemployment, and say why the price level falls only slightly.
Common mistakes
Students often show the price level and real GDP falling by similar amounts. In the Keynesian model, once AD cuts LRAS on the horizontal section, the fall is mostly in real GDP and the price level falls only slightly. Another mistake is to measure the output gap from Y₁ instead of from full-employment output, Yfe: the negative output gap is the distance between actual output, Y₂, and Yfe.
Related diagrams
Ask Otti about this diagram
Our AI tutor can walk you through every curve, explain exam technique, and quiz you on it.