AD Shift Right — Keynesian (At Full Capacity)
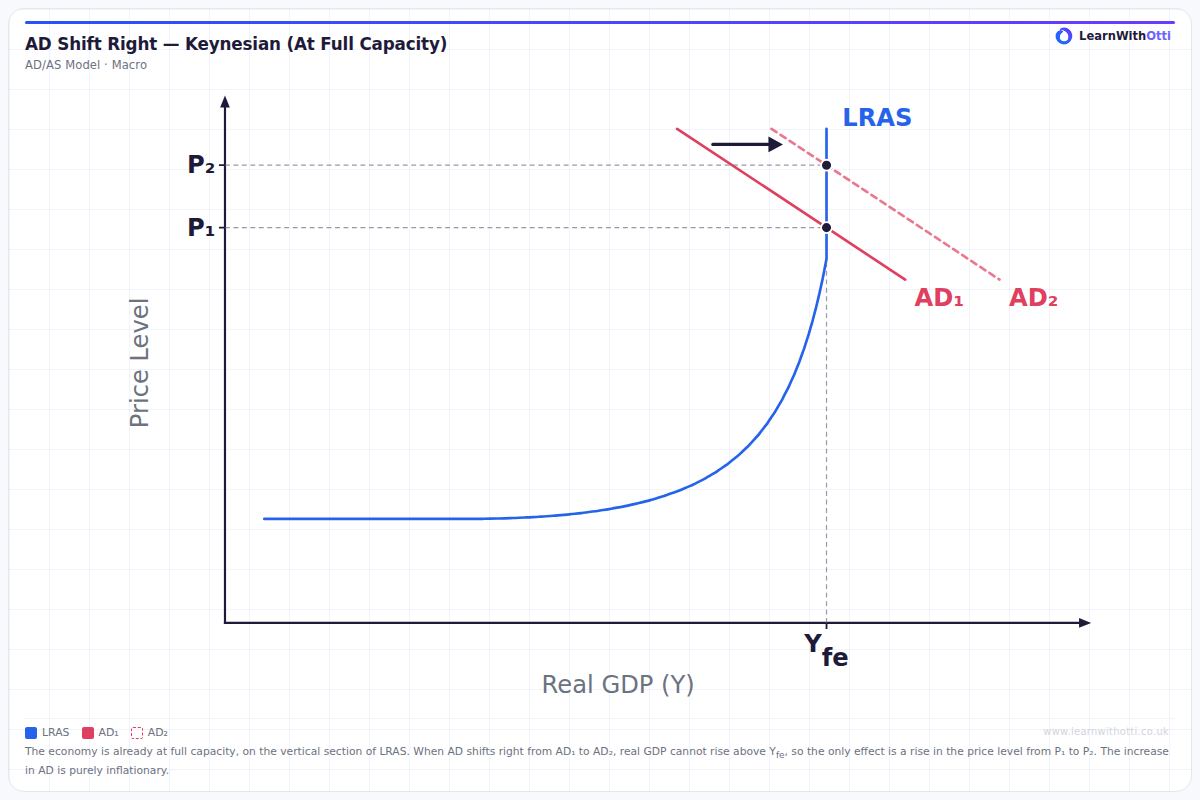
Keynesian AD/AS diagram showing a rightward AD shift on the vertical section of LRAS, where real GDP stays at full capacity and only the price level rises.
Printable preview
Download a static PNG of this diagram to print or include in revision notes.
Download PNGWhat this diagram shows
This diagram shows aggregate demand (AD) shifting to the right, meaning total planned spending in the economy has increased. The economy starts on the vertical section of the Keynesian LRAS curve, where it is already at full capacity, producing full-employment output, Yfe. Because there are no spare resources to bring into production, real GDP cannot rise above Yfe, so the extra demand simply pushes the price level up from P₁ to P₂. This is demand-pull inflation, and it shows that in the Keynesian model the effect of an AD shift depends on where the economy sits on the LRAS curve.
Key points
- The AD curve shifts to the right, from AD₁ to AD₂, representing an increase in aggregate demand (e.g. from higher government spending, consumer confidence or exports).
- LRAS does not shift — only AD moves.
- Because the economy is at full capacity, real output cannot rise; all productive resources are already fully employed, so real GDP stays at Yfe.
- The price level rises from P₁ to P₂, demonstrating demand-pull inflation with no gain in real GDP.
- The vertical section of the Keynesian LRAS curve represents full capacity: at Yfe supply is perfectly inelastic, so any further increase in AD is purely inflationary.
Exam tip
When you draw this diagram, start AD₁ so that it already cuts LRAS on its vertical section, then shift AD to the right to AD₂. Keep real GDP at Yfe for both equilibria and mark the higher price level, P₂, on the price axis. In your explanation, say that the economy has no spare capacity, so the extra demand only raises the price level: this is demand-pull inflation.
Common mistakes
Students often draw real output increasing when AD shifts right in this region, forgetting that at full capacity the economy has no spare resources with which to produce more. On the vertical section of LRAS, a rightward AD shift raises the price level only — real GDP does not change.
Related diagrams
Ask Otti about this diagram
Our AI tutor can walk you through every curve, explain exam technique, and quiz you on it.